Monitor coverage
The Endpoints dashboard answers the question a security team actually has about a fleet: how much of it is covered, and which machines are not. Open it from Endpoint protection > Endpoints in your GitGuardian dashboard.
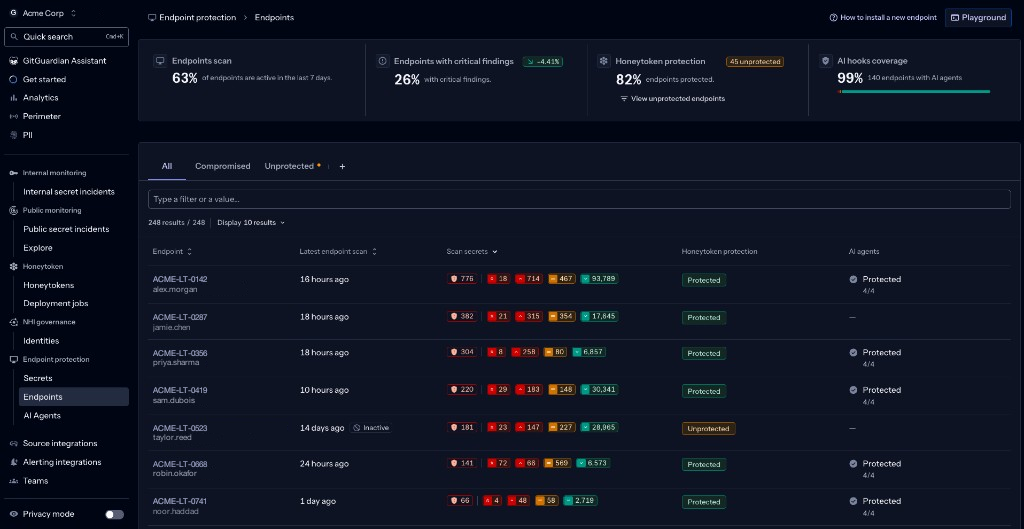
Coverage comes from your deployment, not from a setting here
There is no switch in GitGuardian that turns scanning or honeytoken protection on for a machine. Coverage is a result of which jobs you deploy through your MDM, and this dashboard reports that result.
That distinction matters when you are closing a gap. An endpoint missing from the fleet has no ggshield installed. An endpoint that is never scanned has no inventory job running. An endpoint marked as unprotected has no plant job running. In every case the fix happens in your MDM, and the dashboard is how you confirm it worked. See Deploy Endpoint Protection.
The two capabilities are independent. A machine can be scanned without being planted, or planted without being scanned, so read the two columns separately rather than assuming one implies the other.
Read the coverage KPIs
The cards across the top summarize the fleet:
- Endpoints scan: the share of endpoints that ran a scan recently. This is your scanning coverage, and it drops when scheduled jobs stop firing rather than when machines get riskier.
- Endpoints with critical findings: the share of endpoints carrying at least one critical finding, with a trend against the previous period. This is the one card that measures risk rather than coverage.
- Honeytoken protection: the share of endpoints with a honeytoken planted, alongside a count of unprotected endpoints and a link that filters the table down to them.
- AI hooks coverage: the share of endpoints running AI agents that have guardrails in place.
Work through the endpoints table
Each row is one machine. The columns tell you what is known about it and how recently:
| Column | What it tells you |
|---|---|
| Endpoint | The machine identifier and its owner. |
| Latest endpoint scan | When the machine last reported. An Inactive marker means it has stopped reporting altogether, which is a deployment problem rather than a security finding. |
| Scan secrets | Findings on that machine, broken down by severity. |
| Honeytoken protection | Protected when a honeytoken is planted, Unprotected when none is. |
| AI agents | Whether the AI agents on the machine have guardrails, and how many are covered. |
Use the tabs and the filter bar to turn the fleet view into a work queue:
- All for the whole perimeter.
- Compromised for machines that need investigation now.
- Unprotected for machines with no honeytoken planted, which is the list you work to raise honeytoken coverage.
Investigate a single machine
Selecting a machine opens its detail page, which carries the same split between capabilities: Local scanning for its latest scan, severity counts, and scanner version, and Honeytoken protection for its latest sync and planted honeytokens. Tabs give you discovered secrets, scan history, AI agents, and honeytokens.
For what the honeytoken card and tab show, and how to act on them, see Protect endpoints with Honeytokens. For what to do about the secrets a scan surfaces, see Remediate findings.
Where to go next
- Remediate findings for acting on the secrets discovered on a machine.
- Validate and roll out for the checks to run on a pilot group before you expand.
- What is scanned for the sources behind the findings in the table.
- Data handling and privacy for what leaves the machine.

