Surveiller la couverture
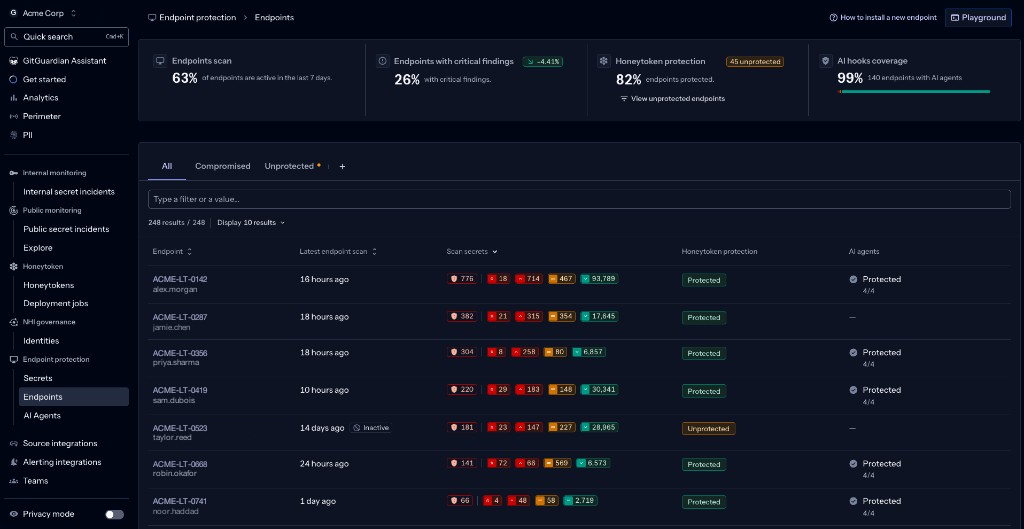
Le dashboard Endpoints répond à la question qu'une équipe de sécurité se pose réellement à propos d'un parc : quelle part est couverte, et quelles machines ne le sont pas. Ouvrez-le depuis Endpoint protection > Endpoints dans votre dashboard GitGuardian.
La couverture vient de votre déploiement, pas d'un paramètre ici
Il n'existe aucun interrupteur dans GitGuardian qui active le scan ou la protection par honeytoken pour une machine. La couverture est le résultat des jobs que vous déployez via votre MDM, et ce dashboard rapporte ce résultat.
Cette distinction compte lorsque vous comblez un manque. Un endpoint absent du parc n'a pas de ggshield installé. Un endpoint qui n'est jamais scanné n'a pas de job d'inventaire en cours d'exécution. Un endpoint marqué comme non protégé n'a pas de job de plantation en cours d'exécution. Dans tous les cas, la correction se fait dans votre MDM, et le dashboard vous permet de confirmer qu'elle a fonctionné. Consultez Déployer Endpoint Protection.
Les deux capacités sont indépendantes. Une machine peut être scannée sans être plantée, ou plantée sans être scannée, alors lisez les deux colonnes séparément plutôt que de supposer que l'une implique l'autre.
Lire les KPI de couverture
Les cartes en haut résument le parc :
- Endpoints scan : la part des endpoints ayant exécuté un scan récemment. C'est votre couverture de scan, et elle baisse lorsque les jobs planifiés cessent de se déclencher plutôt que lorsque les machines deviennent plus risquées.
- Endpoints with critical findings : la part des endpoints portant au moins une découverte critique, avec une tendance par rapport à la période précédente. C'est la seule carte qui mesure le risque plutôt que la couverture.
- Honeytoken protection : la part des endpoints avec un honeytoken planté, ainsi qu'un décompte des endpoints non protégés et un lien qui filtre le tableau pour ne montrer que ceux-là.
- AI hooks coverage : la part des endpoints exécutant des agents IA disposant de garde-fous.
Parcourir le tableau des endpoints
Chaque ligne correspond à une machine. Les colonnes vous indiquent ce que l'on sait à son sujet et à quel point c'est récent :
| Colonne | Ce qu'elle vous indique |
|---|---|
| Endpoint | L'identifiant de la machine et son propriétaire. |
| Latest endpoint scan | La date à laquelle la machine a rapporté pour la dernière fois. Un marqueur Inactive signifie qu'elle a totalement cessé de rapporter, ce qui est un problème de déploiement plutôt qu'une découverte de sécurité. |
| Scan secrets | Les découvertes sur cette machine, ventilées par sévérité. |
| Honeytoken protection | Protected lorsqu'un honeytoken est planté, Unprotected lorsqu'il n'y en a aucun. |
| AI agents | Si les agents IA de la machine disposent de garde-fous, et combien sont couverts. |
Utilisez les onglets et la barre de filtres pour transformer la vue du parc en file de travail :
- All pour l'ensemble du périmètre.
- Compromised pour les machines nécessitant une investigation immédiate.
- Unprotected pour les machines sans honeytoken planté, qui est la liste sur laquelle vous travaillez pour augmenter la couverture par honeytoken.
Examiner une seule machine
Sélectionner une machine ouvre sa page de détail, qui reprend la même distinction entre capacités : Local scanning pour son dernier scan, les décomptes de sévérité et la version du scanner, et Honeytoken protection pour sa dernière synchronisation et les honeytokens plantés. Les onglets vous donnent les secrets découverts, l'historique des scans, les agents IA et les honeytokens.
Pour ce que la carte et l'onglet honeytoken affichent, et comment agir dessus, consultez Protéger les endpoints avec des Honeytokens. Pour savoir quoi faire à propos des secrets qu'un scan révèle, consultez Remédier aux découvertes.
Où aller ensuite
- Remédier aux découvertes pour agir sur les secrets découverts sur une machine.
- Valider et déployer pour les vérifications à effectuer sur un groupe pilote avant d'étendre.
- Ce qui est scanné pour les sources à l'origine des découvertes du tableau.
- Traitement des données et confidentialité pour ce qui quitte la machine.

