
Check your performance
Please note that the IaC analytics features are currently in private beta. To activate them, please join the waitlist directly from your GitGuardian dashboard!
Overview
As remediating your existing IaC incidents is a key step toward a more securely fortified infrastructure, monitoring your advancement through analytics becomes essential.
The following analytics will help you better grasp the health of your IaC, track your progress over time and leverage new opportunities for improvement.
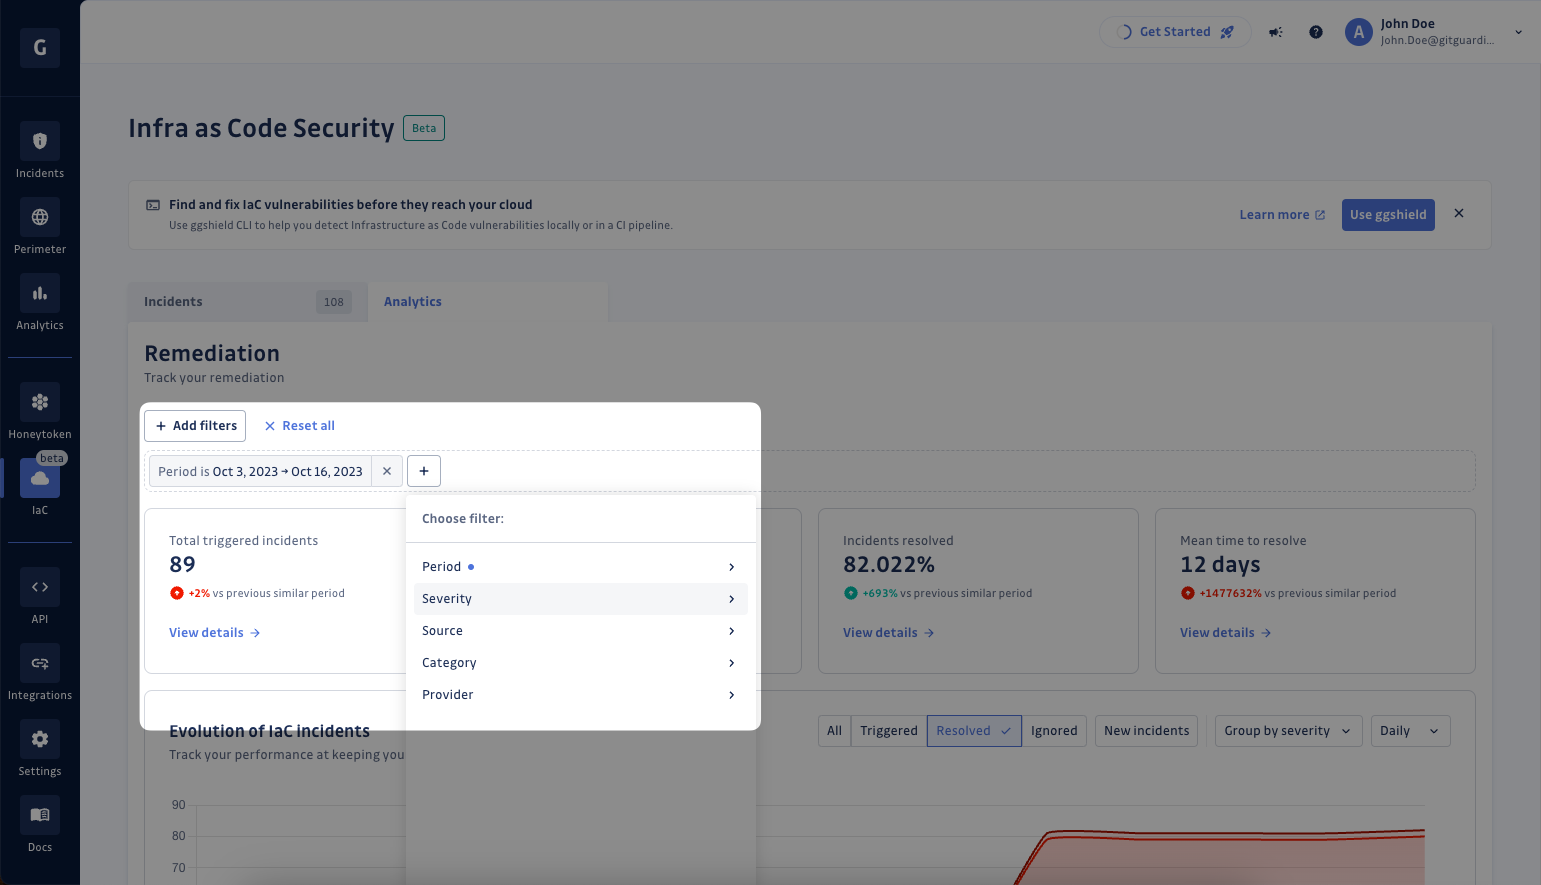
The metrics and graphs described below can be globally filtered using multiple criteria such as the incident's severity, the targeted provider or the source where the incident has been detected.
Grasp the health of your IaC
At the top of the IaC Analytics section, you can first access the health of your IaC based on:
- The number of Total triggered incidents, i.e. the total number of incidents to be resolved during the selected period.
- The number Total new incidents, i.e. the number of newly triggered incidents to be resolved during the selected period.
- The % of Incidents resolved, i.e. the rate of Total triggered incidents resolved during the selected period.
- The Mean time to resolve, i.e. the average time it takes for an incident to be resolved during the selected period.
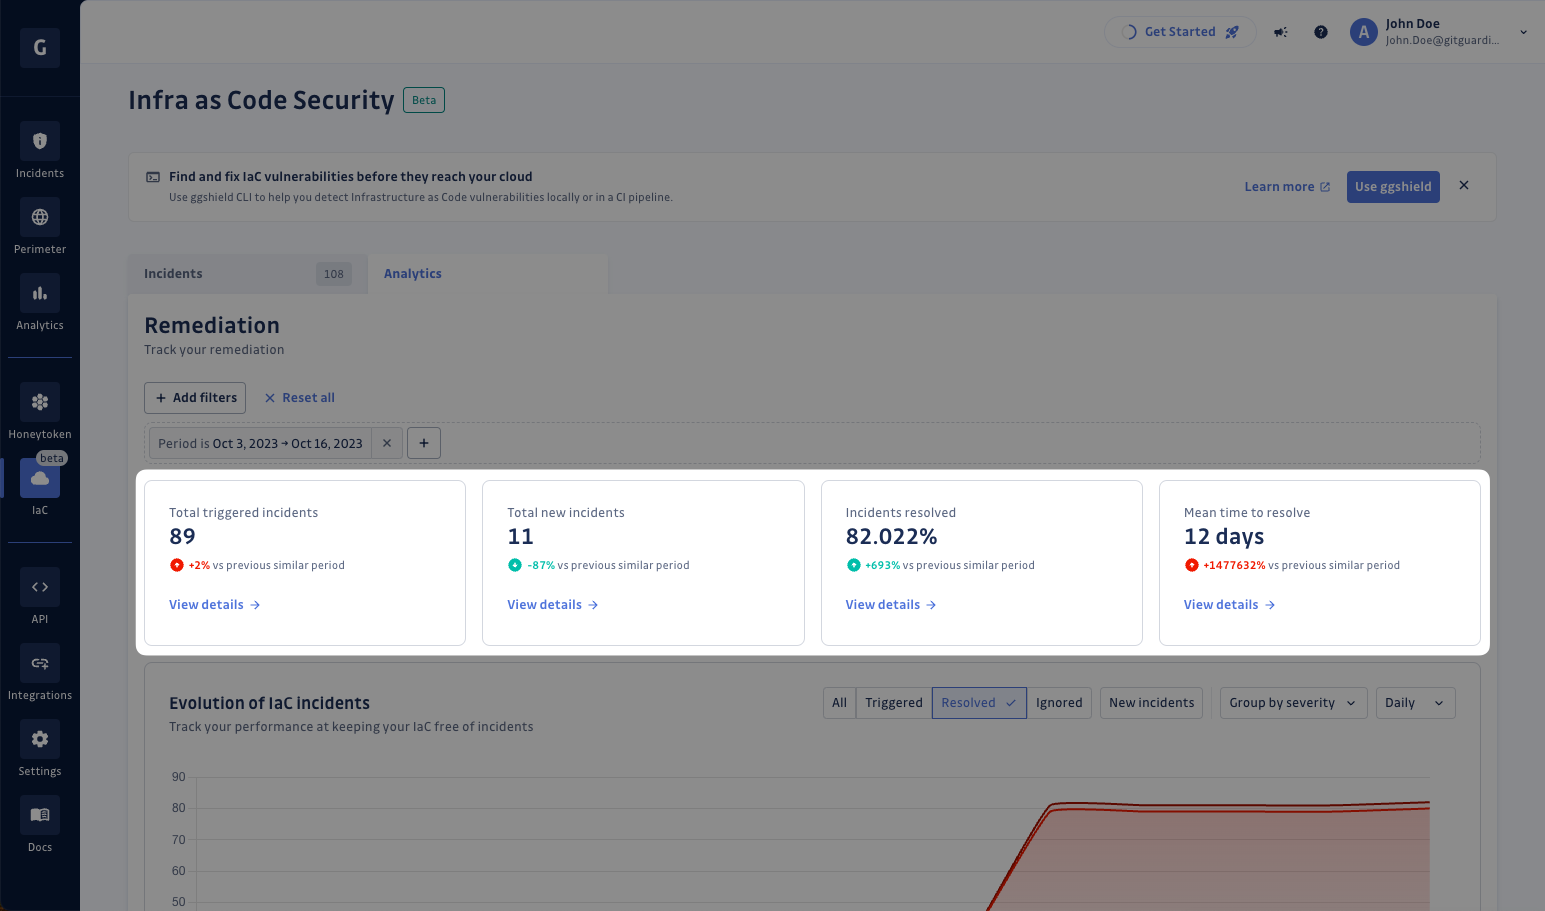
Check the trend of each metric and analyze your performance since the same period in the past.
Track your progress over time
You can then assess your capability in keeping your IaC free of incidents and your efficiency in resolving them based on:
- The evolution of the number of IaC incidents, by viewing all of them, or by selecting only Triggered, Resolved, Ignored or Newly triggered incidents.
- The evolution of the Incident resolution rate as well as of the Mean time to Resolve.
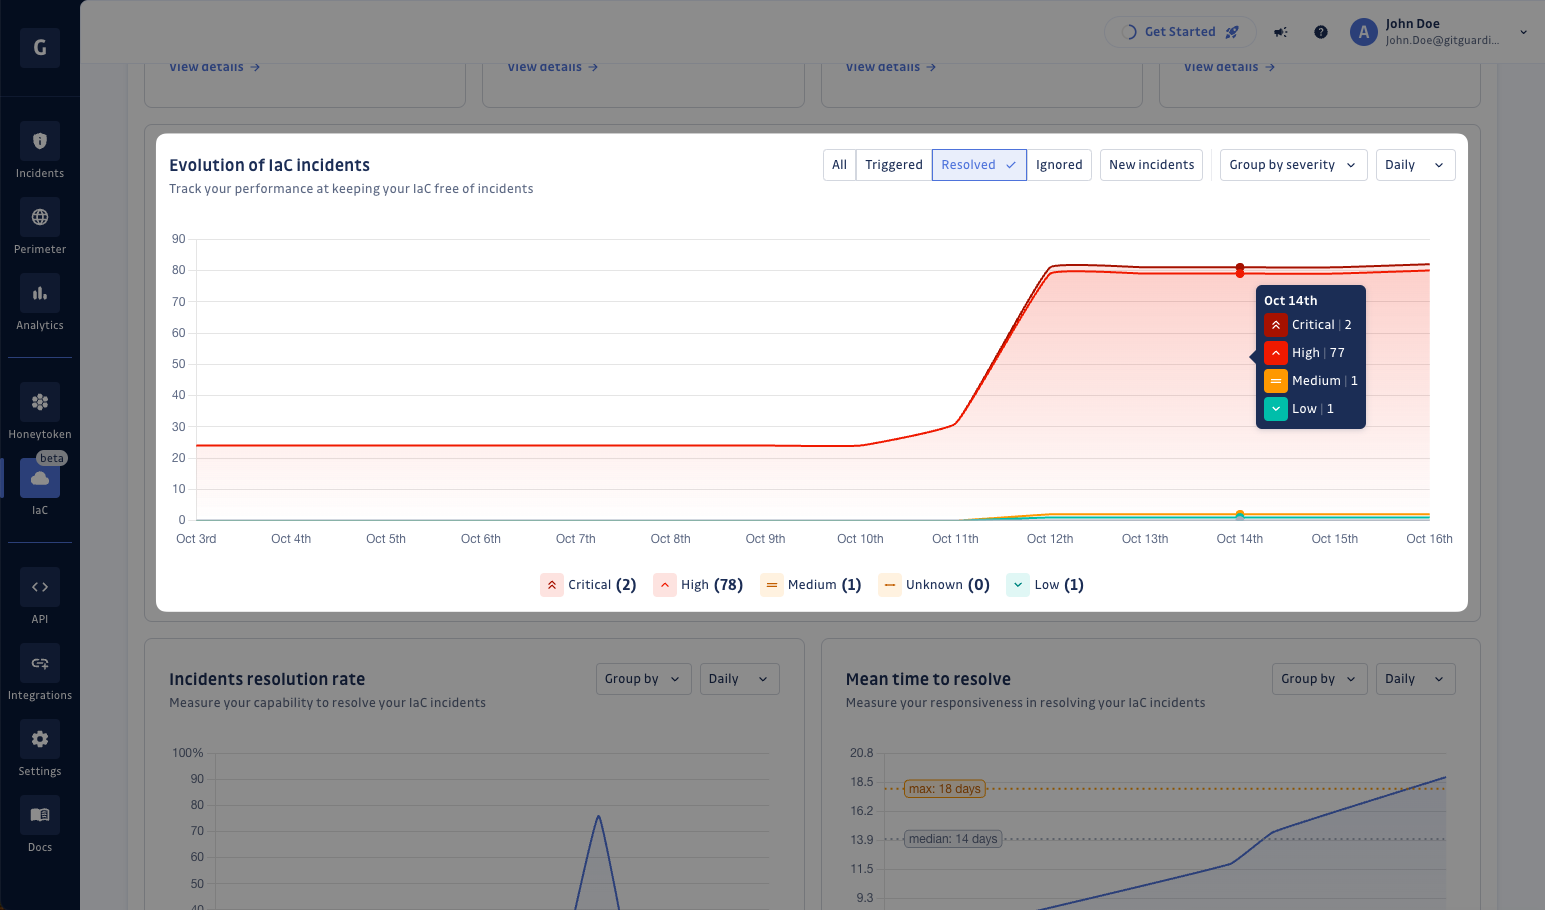
The above graph relies on snapshots created at the end of each time interval (end of day, end of week, ...). For instance, if an incident is ignored and then reopened on the same day, it will not be counted as ‘Ignored’ for that specific date.
![]()
Group your analytics by Provider, Severity, or Category to tailor results to your needs.
Leverage opportunities for improvement
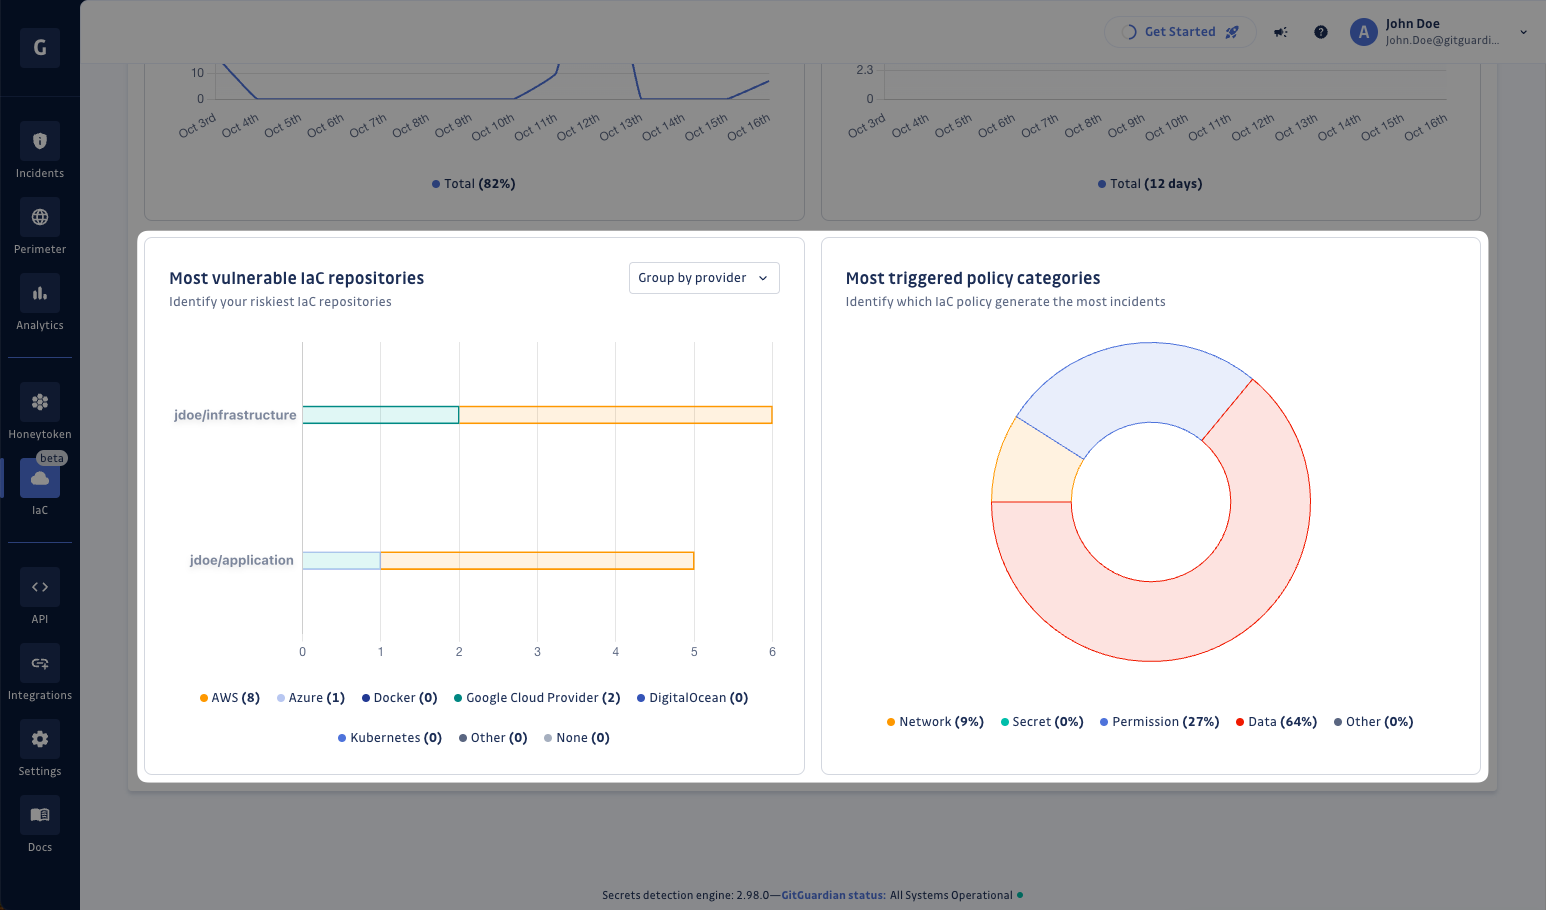
Finally, you can further improve the security of your IaC by identifying the most significant remaining risks based on:
- The Top 5 most vulnerable IaC sources.
- The policy categories that trigger the most incidents.
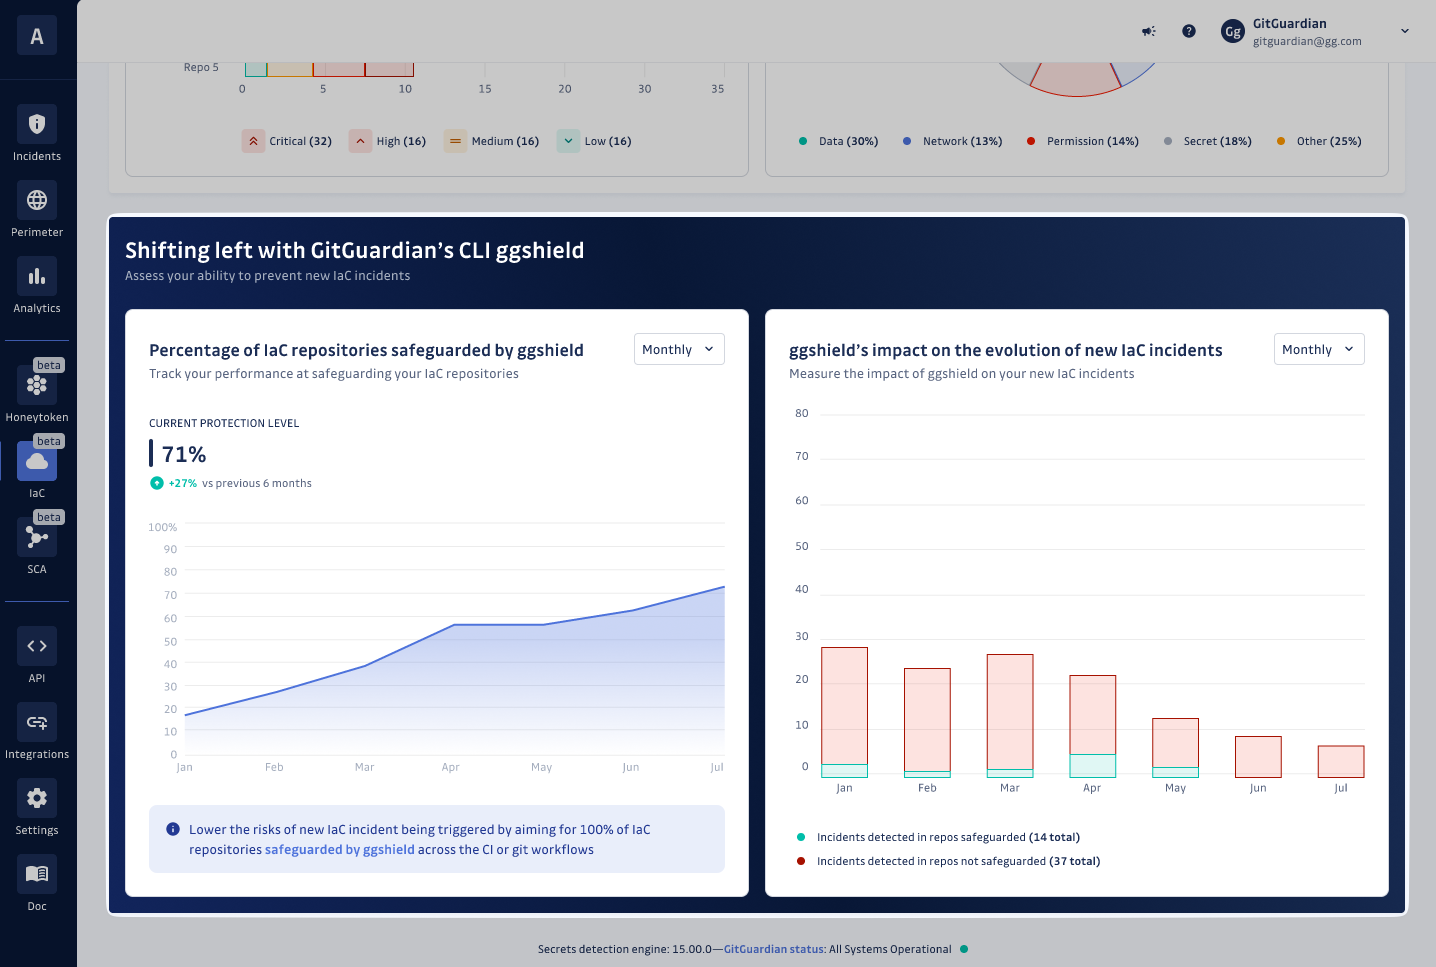
Shifting left metrics
What does 'safeguarded' mean?
In the context of IaC, a repository is deemed 'safeguarded' when it is scanned for security risks and misconfigurations using ggshield. This process helps ensure that your infrastructure's code adheres to security best practices, thereby reducing the likelihood of incidents.
How to safeguard with ggshield?
Safeguarding takes place through one of two methods:
CI/CD pipeline integration: When ggshield is integrated into your CI/CD pipeline, a repository is considered safeguarded after at least one successful execution of a
ggshield iac scan cijob. This method ensures that scans are part of the automated deployment process.Manual scans via service account: A repository can also be safeguarded by manually executing a
ggshield iac scancommand using a Service Account. This method is useful for ad-hoc scans or in environments where CI/CD integration is not yet in place.
Why safeguard your IaC repositories?
Safeguarding your IaC repositories with ggshield scans is a proactive step towards securing your infrastructure. It enables you to detect and address vulnerabilities early, maintain compliance, and foster a culture of security within your development lifecycle.
Was this page helpful?


