Internal Monitoring
GitGuardian's Analytics offers robust data visualization and actionable insights, empowering you to monitor your security posture, track performance trends, and make informed decisions.
Analytics are only accessible to:
- Workspace Owner and Managers.
- Members with
Full accessincident permissions on the All-incidents team.
Analytics are computed once daily. Data may take up to 24 hours to appear for new self-hosted installations or new SaaS workspaces.
Monitor your security posture across 4 dimensions
The Internal Monitoring Analytics is structured to deliver clear, in-depth insights across four key security areas:
- "Protect" section provides an overview of your current monitoring coverage
Once you have enabled full-breadth coverage on your sources, your focus shifts to two main objectives: stopping new leaks and resolving existing incidents.
- "Detect" section helps you identify the sources and teams involved in leaks, including recurring issues, so you can plan training or actions to reduce and prevent them.
- "Remediate" section guides you in addressing existing incidents, prioritizing the most critical cases, and leveraging GitGuardian’s automated remediation tools.
- "Prevent" section helps you track and assess whether your prevention strategy is effective, and ensures that appropriate measures are in place to prevent future problems.
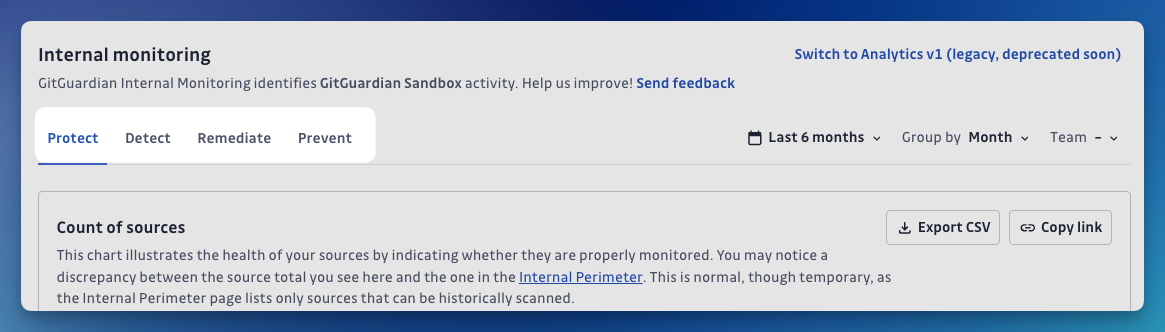
Protect
Navigate to the Analytics page in your GitGuardian dashboard, select Internal Monitoring, and then click on the Protect tab. Purpose: These analytics indicates how healthy your sources are regarding coverage. Are they monitored effectively? Do you have any gaps? How many commits are scanned, and how many secrets are found?
-
Count of Sources: Displays the percentage of monitored sources over time, helping identify whether all sources are properly monitored and highlighting discrepancies between total sources and those eligible for historical scanning.
-
Count of Sources by Category: Shows the percentage of monitored sources by category (e.g., code repositories), providing insight into which source types are monitored and identifying any under-monitored categories.
-
Percentage of Blocked GitHub PRs: Illustrates the percentage of GitHub pull requests blocked from merging due to detected secrets, indicating the effectiveness of secret detection in preventing sensitive data leaks via PRs.
-
GitHub PRs with Check Runs: Shows the total number of GitHub PRs scanned by GitGuardian, tracking coverage and integration of secret scanning in the PR workflow.
-
Percentage of Commits Containing Secrets: Displays the percentage of commits containing secrets out of the total commits scanned, helping assess the prevalence of hardcoded secrets codebases over time.
-
Commits Scanned: Shows the total number of commits scanned for secrets, regardless of whether secrets were found, indicating overall scanning activity and coverage.
Detect
Navigate to the Analytics page in your GitGuardian dashboard, select Internal Monitoring, and then click on the Detect tab.
Purpose: These analytics offers insights into where and how secrets are detected, highlighting incident creation. These help you understand where and how secrets are being detected in your organization, which types of secrets are most problematic, and which sources and teams are most frequently involved. This allow you to understand where the leaks come from and how important they are.
-
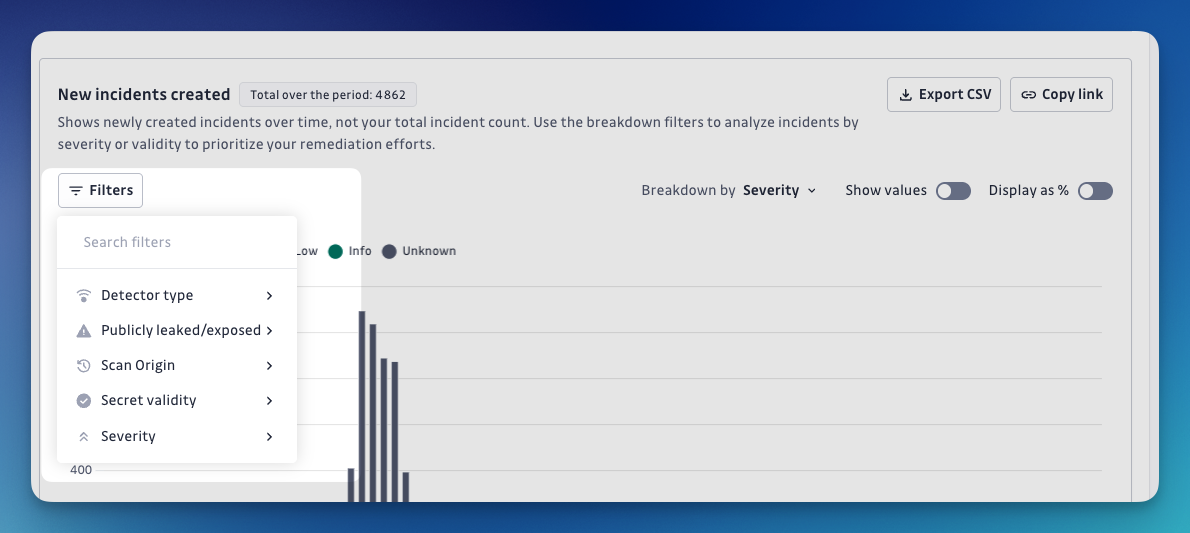
New incidents created: Shows the number of newly created incidents over time, categorized by severity (Critical, High, Medium, Low, Info, Unknown) or validity. Helps prioritize remediation efforts by visualizing when and how many incidents of each severity occur.
-
Most detected secrets: Displays the most frequently detected secret types (e.g., generic high entropy secrets, passwords, API keys, credentials). Useful for identifying which kinds of secrets are most commonly leaked and may require targeted prevention or education.
-
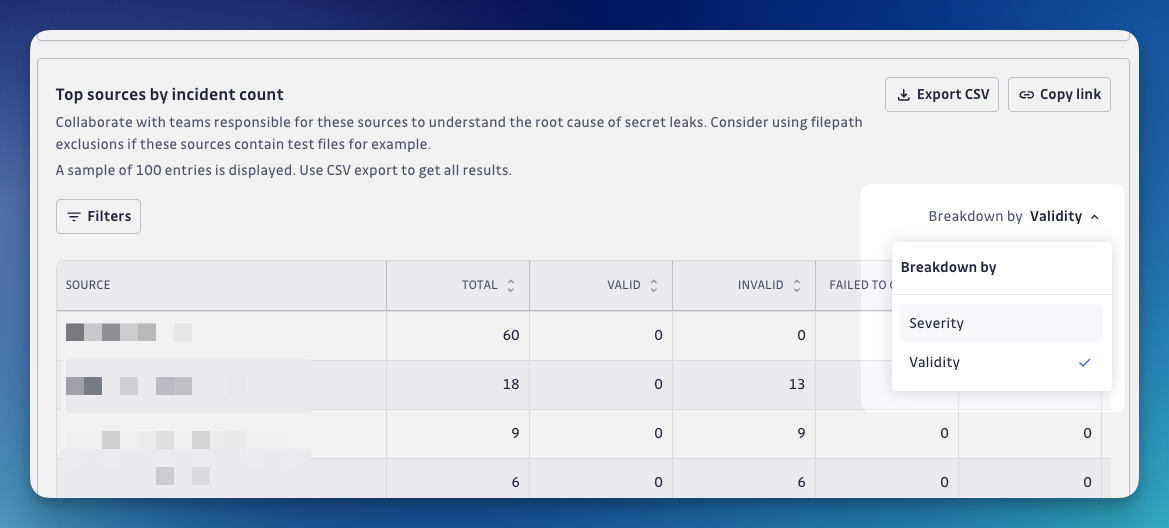
Top sources by incident count: Lists the sources (repositories, etc.) responsible for the most incidents, broken down by severity or validity. Helps pinpoint where secret leaks are originating, so you can focus remediation and exclusion efforts on problematic sources.
-
Top teams by incident count: Shows which teams are responsible for the most incidents, broken down by severity or validity. Useful for identifying teams that may need additional training, support, or process improvements to reduce secret leaks.
Remediate
Navigate to the Analytics page in your GitGuardian dashboard, select Internal Monitoring, and then click on the Remediate tab.
Purpose: These analytics help you track and prioritize the most critical cases, monitor the status of open and closed incidents, and measure the effectiveness of your remediation efforts. By leveraging GitGuardian’s automated remediation tools, you can streamline incident resolution, reduce backlog, and continuously improve your incident response processes.
-
Average open incidents per source (code repositories only): Tracks the average number of unresolved incidents per code repository over time. Helps monitor whether remediation efforts are keeping pace with incident creation and highlights trends in backlog.
-
Open incidents: Shows the total number of incidents that are currently unresolved and require attention. Useful for understanding the current workload and prioritizing remediation.
-
Closed incidents: Displays the total number of incidents that have been resolved and closed over time. Indicates remediation progress and effectiveness.
-
Auto-closed by GitGuardian automations: Shows incidents that were automatically closed by system automations. Highlights the efficiency and impact of automated remediation.
-
Top teams by closed incidents: Lists teams that closed the most incidents during the selected period. Helps identify high-performing teams and distribute workload insights.
-
Top sources by closed incidents: Identifies sources (repositories, directories, etc.) with the most incidents closed during the selected period. Useful for prioritizing remediation efforts and understanding which sources are being effectively managed.
-
Median time to remediate: Displays the median time taken to resolve incidents each month. Helps monitor changes in response times, identify trends, and pinpoint areas for improvement in remediation processes.
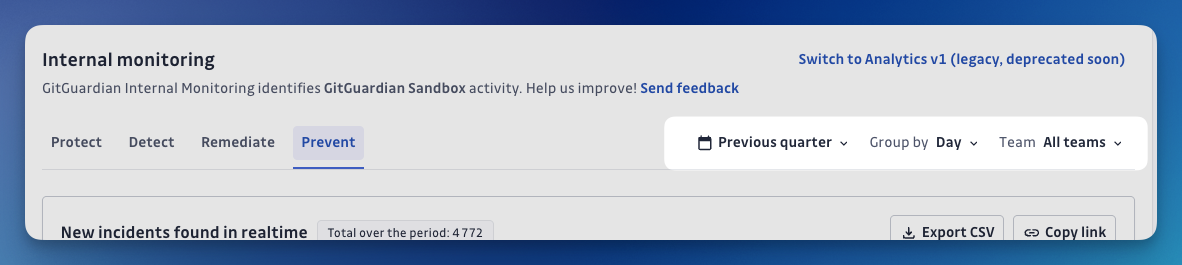
Prevent or "Shift Left" protection
Navigate to the Analytics page in your GitGuardian dashboard, select Internal Monitoring, and then click on the Prevent tab.
Purpose: These analytics help you measure the effectiveness and adoption of your secret leaks prevention strategies through GGShield. Here, you can track incidents avoided, scan activity, and developer engagement, helping you ensure that preventive measures are in place and effective. These insights empower you to assess the impact of your preventive controls and continuously improve your organization’s secret management practices.
-
New incidents found in realtime : Shows the number of new incidents detected in real time. Helps monitor immediate risk and the effectiveness of real-time secret detection.
-
Total count of incidents avoided by GGShield :Tracks the number of incidents prevented by GGShield scans (e.g., pre-commit, path, pre-push, etc.), demonstrating the tool’s effectiveness in stopping hardcoded secrets before they become security incidents.
-
GGShield scans over time : Shows the total number of GGShield CLI scans executed during the selected period, broken down by scan mode (e.g., pre-commit, path, pre-push, etc.). Indicates adoption, usage patterns, and coverage of secret scanning across workflows.
-
Active GGShield users : Displays the number of unique developers actively using GGShield, counted by Personal Access Token usage in the last 30 days. Helps track engagement and adoption of secret prevention tools among developers.
Analytics Tools
Page level filters
 With page-level tools, you can filter the entire page by:
- A specific time period (e.g., "Last 3 months", "All time")
- Custom time intervals ("buckets") such as day, week, month, or year
- A particular team
- Not all charts support team-based filtering. If a chart does not support team filtering, a specific warning will appear.
- Certain filter selections (such as "all time" combined with "group by day") may not be rendered due to data volume limitations. In these cases, a warning will also be displayed.
Chart level tools
At the chart level, you have several tools to help you customize and analyze your data:
Filters
Apply filters directly to individual charts to focus on specific data segments
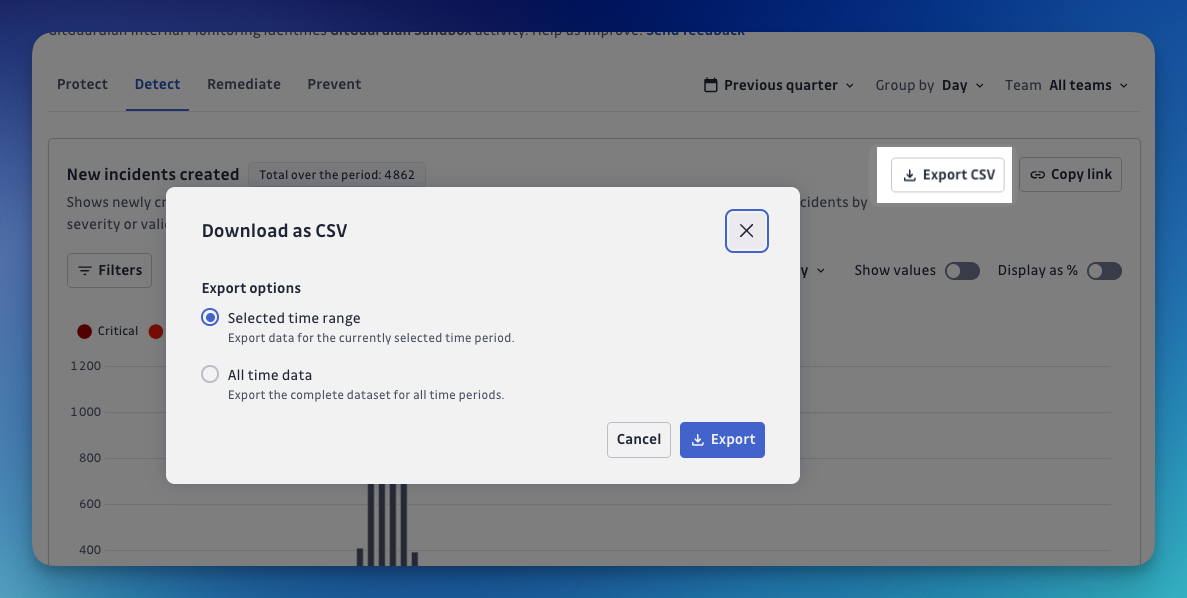
CSV export
You can export the data from any chart as a CSV file for use in external analysis or reporting tools.
The exported CSV reflects any breakdowns you have applied.
Breakdowns
Break down your chart data by various dimensions (such as severity, validity, etc.) to uncover deeper insights and make comparisons across different categories.
Table charts automatically adjust their columns based on the selected breakdown.
Display options: Show/Hide specific breakdown values
Easily display or hide specific breakdown categories in your chart to concentrate on the data that matters most to you.
Display options: Show/Hide values or percentages
Easily switch between displaying absolute values and percentages on your charts to tailor data visualization to your preferences and analysis needs.