Overview
The Analytics Overview page provides executives and security leaders with an instant pulse on your organization's security posture. It aggregates key performance indicators (KPIs) from across the GitGuardian platform into a single, streamlined dashboard designed for leadership reviews and status reporting.
Analytics are computed once daily. Data may take up to 24 hours to appear for new self-hosted installations or new SaaS workspaces.
Access the Overview dashboard
Navigate to Analytics > Overview in your GitGuardian dashboard. Use the time period selector in the top-right corner to adjust the reporting window (e.g., "Last quarter", "Last month").
Unified KPI strip
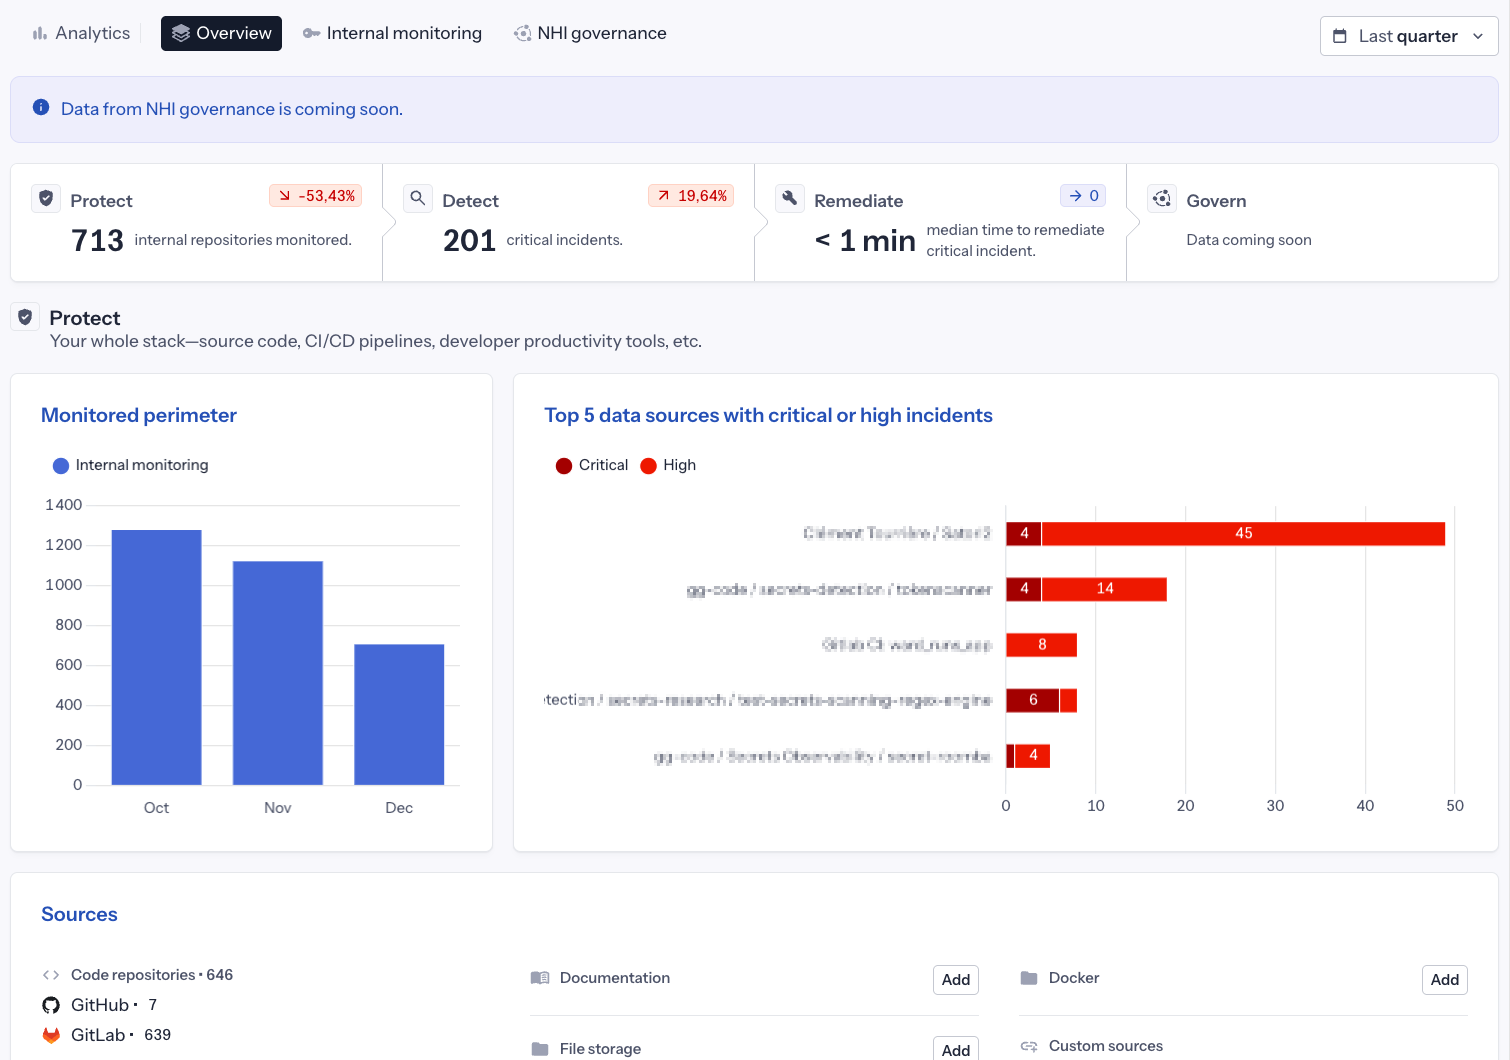
At the top of the page, four KPIs provide a quick status check across all security dimensions:
| KPI | Description |
|---|---|
| Protect | Number of internal repositories currently monitored, with trend indicator showing coverage changes |
| Detect | Count of critical incidents detected, with trend indicator |
| Remediate | Median time to remediate critical incidents |
| Govern | NHI governance metrics (coming soon) |
Each KPI includes a trend indicator showing percentage change, helping you quickly identify improvements or areas needing attention.
How trend percentages are calculated:
The trend percentage compares today's value to the value from the start of your selected time period:
- Last month: Compares today's data to the value from 30 days ago
- Last quarter: Compares today's data to the value from 90 days ago
For example, if you select "Last quarter" and your monitored repositories increased from 500 to 713, the trend indicator shows +42.6%.
Protect section
The Protect section focuses on your monitoring coverage:
Monitored perimeter
A bar chart showing the evolution of your monitored source count over time. Use this to:
- Track how your coverage grows month over month
- Identify drops in coverage that may indicate configuration issues
Top data sources with critical or high incidents
A horizontal bar chart highlighting which repositories generate the most critical and high-severity incidents. This helps you:
- Identify where risk concentrates in your organization
- Prioritize remediation efforts on high-risk repositories
- Focus developer training on teams owning problematic sources
Sources summary
At the bottom of the page, a summary card displays your connected sources:
- Code repositories: Total count with breakdown by provider (GitHub, GitLab, etc.)
- Documentation: Confluence, SharePoint, and other documentation sources
- File storage: OneDrive, Google Drive, and similar services
- Docker: Container registry sources
- Custom sources: Any custom integrations
Use the Add buttons to quickly expand your monitoring perimeter to new source types.
Use cases
Leadership reviews
Use the Overview dashboard for weekly or monthly security reviews:
- Check the KPI strip for a quick status assessment
- Review trend indicators to validate progress against goals
Status reporting
Generate executive summaries by:
- Selecting the appropriate time period
- Capturing the KPI strip for high-level metrics
- Highlighting top risky data sources that need attention
Related documentation
- Internal Monitoring Analytics - Detailed analytics across Protect, Detect, Remediate, and Prevent dimensions

