4 posts tagged with "analytics"

View All Tags

Spot your uncovered assets. Close your blindspot in one click!

calendar icon   Release Date: September 28, 2026

Coverage Hub on the perimeter page

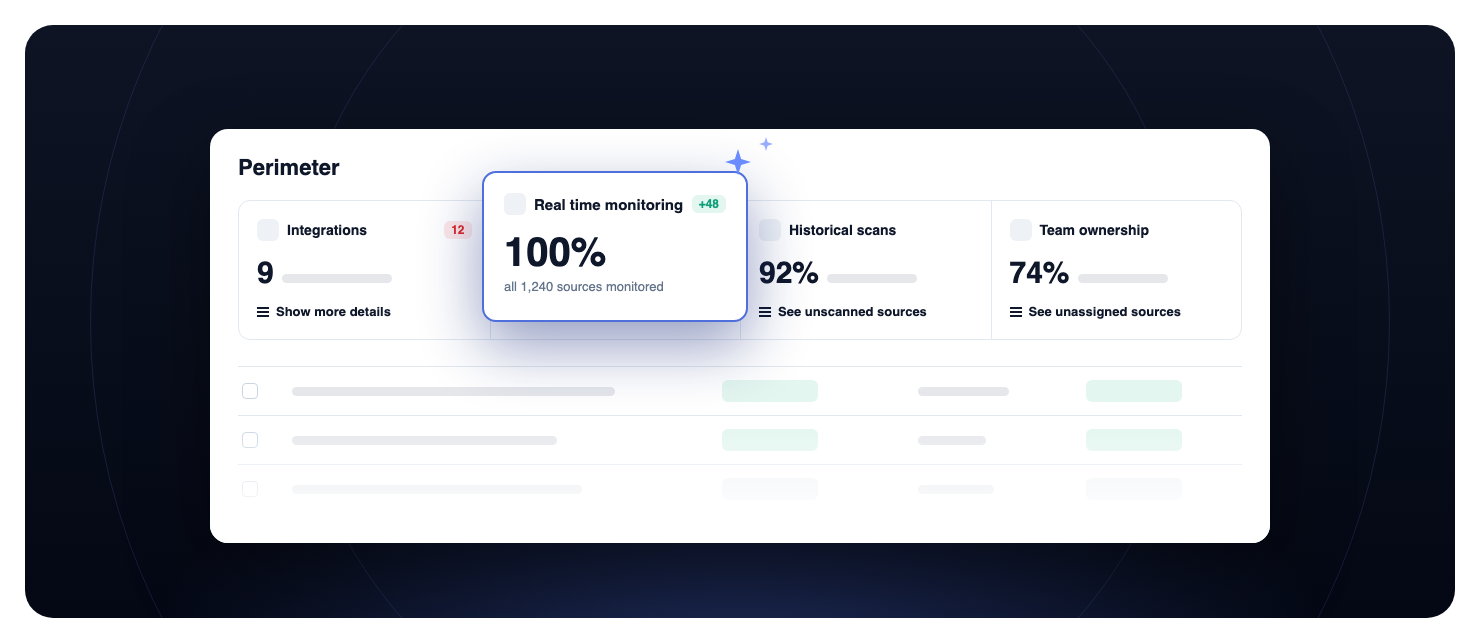
Is every source monitored? Has every source been scanned? Does every source have an owner? The perimeter page now answers these questions at the top, with the Coverage Hub.

What does this mean for you?

  • Your coverage at a glance: four cards show your installed integrations, the share of sources monitored in real time, the share scanned successfully, and the share owned by a team.
  • One click to the gap: card actions filter the sources table on the sources that need action: unmonitored, unscanned, or unassigned.
  • Unreachable sources stand out: a red badge counts the sources GitGuardian cannot reach. Show more details lists your integrations with their sources, and flags the ones with unreachable sources.
  • Sources at risk first: the table is sorted by open incidents. The Has open incidents filter replaces the Health filter, and your saved views are migrated.
  • Team ownership in the table: the new Teams column shows the teams of each source, and the No team assigned option of the Team filter lists the sources without one.

Why is this important?

Two gaps keep secrets exposed: unmonitored sources remain a blind spot, and often hide critical secrets that still work, while sources without a clear owner delay secret revocation for a long time. Either way, the door stays open. The Coverage Hub makes both gaps visible and puts the fix one click away.

Get Started Today!

Open your perimeter page, click an action on a card, then select the sources and use a bulk action to monitor, scan, or assign them.

Manage your monitored perimeter

Enhancements​

  • Perimeter bulk actions: an action that does not apply to your selection is now grayed out, with a tooltip that explains why. When you monitor, unmonitor, or scan more than 30 sources, or when some sources will be skipped, the confirmation lists the skipped sources and why. See Bulk actions on perimeter sources.
Analytics Overview - Executive Bird's-Eye View of Security Posture

calendar icon   Release Date: December 19, 2025

Analytics Overview thumbnail

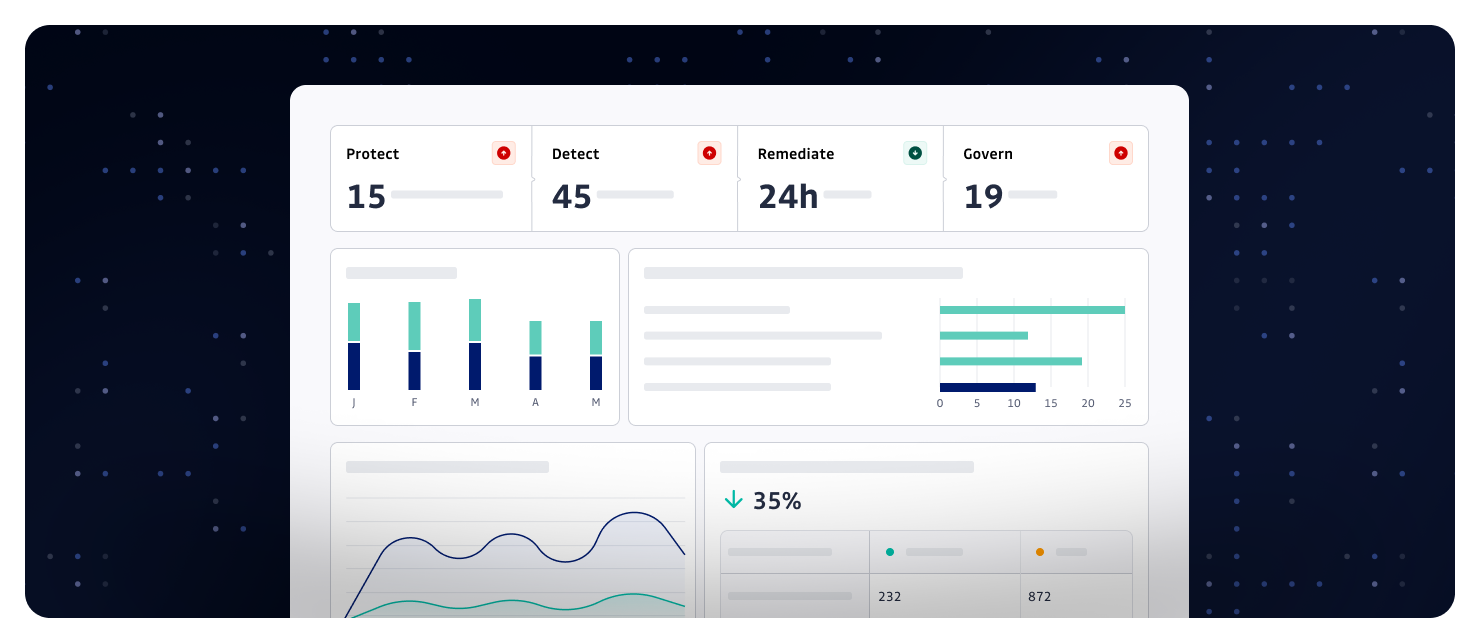
We're launching a streamlined Overview Analytics page that gives executives an instant pulse on security posture. At the top, unified KPIs for Protect, Detect, Remediate, and Govern surface repository coverage, incident volume, remediation speed, and identity safeguards—all at a glance.

What does this mean for you?

  • Unified KPI Strip: Quick status check across all security dimensions—repository coverage, critical incidents, remediation time, and governance metrics.
  • Monitored Perimeter Trends: Visualize how your monitored repository count evolves week over week.
  • Top Risky Data Sources: Identify which repositories generate the most critical and high-severity incidents.
  • Critical Incident Trajectories: Track how incident volume changes over time to spot emerging risks.
  • Most Common Secret Types: Understand which secret categories appear most frequently in your perimeter.
  • Closure Progress: Monitor remediation performance including auto-closures and manual resolutions.
  • Governance Signals: View vaulted secrets and breached policies for NHI governance insights.

Why is this important?

This view is purpose-built for leadership reviews and status reporting. Use it to:

  1. Identify where risk concentrates: Quickly pinpoint which data sources need immediate attention.
  2. Measure response speed: Track how fast teams respond to security incidents.
  3. Plan coverage expansion: Understand where monitoring should grow next.
  4. Demonstrate progress: Show month-over-month / quarter-over-quarter improvements in security posture.

Get started

Navigate to Analytics > Overview to access the new dashboard. Use the KPI strip for a quick status check, then drill into each section to pinpoint hotspots and validate remediation performance.

Learn more about Analytics overview


Fixes​

  • Risk Score: Removed an empty bullet point that appeared in the risk score explanation when no specific factors were highlighted.
  • GitHub Check runs: Fixed an issue where check runs continued to run and block pull requests despite being disabled by property.

New Analytics - Gain Deeper Insights into Your Security Posture

calendar icon   Release Date: July 23, 2025

illustration

We're excited to announce a major update to Internal Monitoring: comprehensive analytics dashboards that empower you to monitor, investigate, and improve your organization's security posture across four key dimensions—Protect, Detect, Remediate, and Prevent.

Get answers to your most important security questions with new, interactive charts and tables:

Are your code repositories fully monitored for secrets? See the Count of sources chart to track the percentage of monitored repositories over time.

Which types of secrets are most frequently detected in your codebase? Explore the Most detected secrets chart to identify the most common secret types found.

Which teams and sources are most at risk for secret leaks? Check the Top teams by incident count and Top sources by incident count tables to pinpoint where incidents originate.

Is your team resolving security incidents quickly enough? Review the Median time to remediate chart to monitor how fast incidents are being resolved.

How effective are your secret prevention tools in stopping leaks before they happen? Analyze the Total count of incidents avoided by GGShield and GGShield scans over time charts to measure prevention and adoption.

With these new analytics, you can:

  • Visualize monitoring coverage and trends
  • Identify the most common and riskiest secrets
  • Track incident detection and remediation performance
  • Measure the impact of prevention tools like GGShield
  • Drill down by team, source, and severity for targeted action

Start exploring the new dashboards today to drive smarter, data-driven security decisions!

Read documentation


Enhancements​

  • GitLab integration: Configuration of multiple GitLab integrations using both system hooks and group hooks simultaneously is now supported

Customize Your Incidents View for Enhanced Context Exploration

calendar icon   Release Date: May 2, 2025

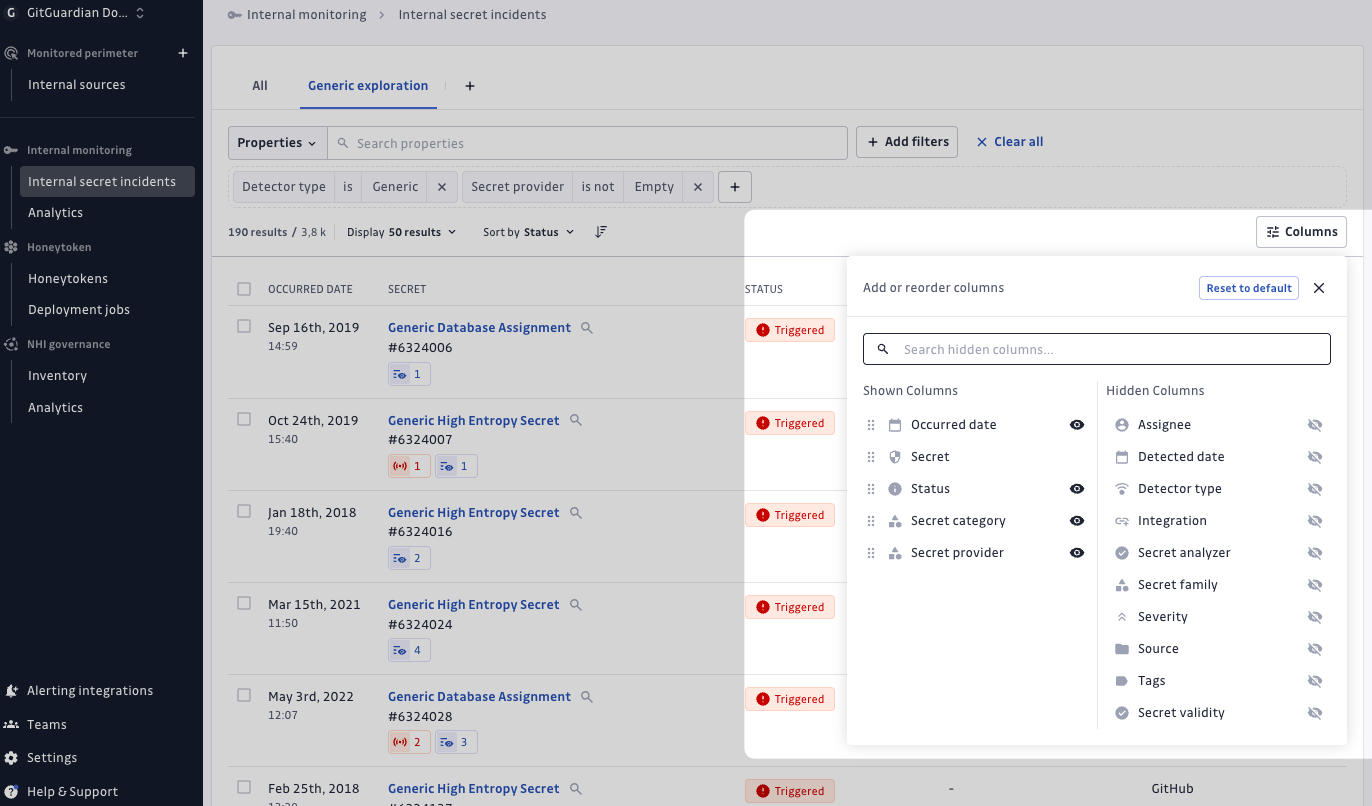
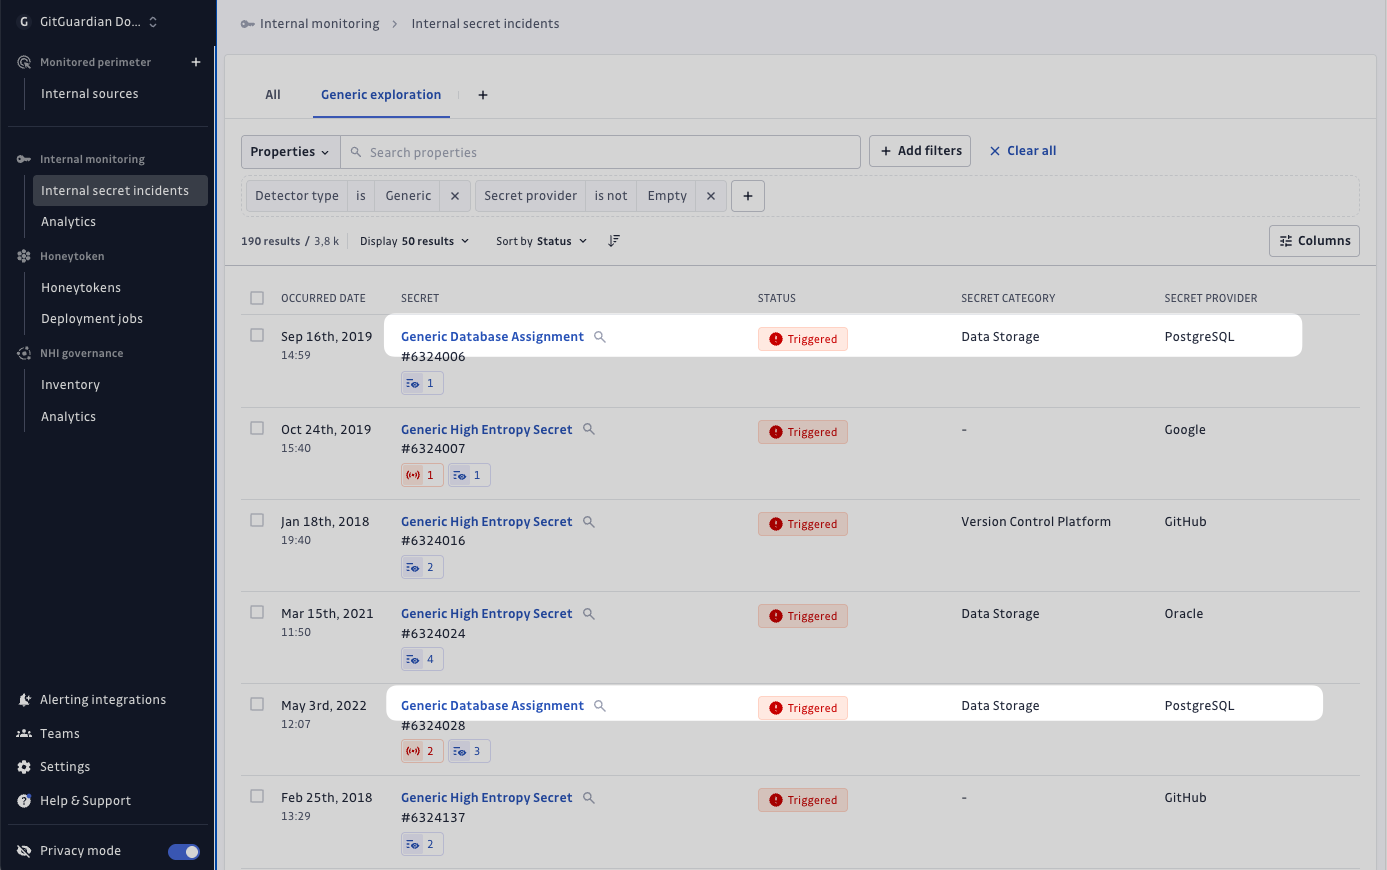
With this new feature, users can create fully customized views of their incidents, displaying specific properties and exploring their security data in an entirely new way.

GSE-columns


This customization capability offers two key advantages:

  1. Leverage the Generic Secret Enricher model (read release page) - You can now explore and prioritize generic incidents more effectively by visualizing the AI-classified secret categories and providers GSE-columns
  2. Harness extensive incident context - Access the rich contextual data we provide for each incident, which is essential for efficient prioritization efforts

Context is critical for effective remediation. CyberSecurity is fundamentally a data business, and by collecting and presenting the richest, most structured context possible, we enable you to filter, sort, and prioritize incidents effectively and make informed decisions.

Read more in the documentation