Applicative metrics
Export Application Metrics to Prometheus
Applicative metrics are gathered thanks to Prometheus, a software used for event monitoring and alerting, which permits scraping the data captured in the application.
The Prometheus exporter is not supported for embedded clusters.
Metrics available
The Prometheus exporter gives access to the following metrics, grouped by area.
Users and incidents
| Metric | Type | Description | Dimensions |
|---|---|---|---|
gim_active_users_total | Gauge | All users in the instance | None |
gim_issues_total | Gauge | All incidents | Severity, Status |
gim_occurrences_total | Gauge | All occurrences | Hidden, Status |
Scanning activity
| Metric | Type | Description | Dimensions |
|---|---|---|---|
gim_commits_total | Gauge | Commits processed | Account, Scan type |
gim_repo_scan_active_statuses_total | Gauge | Count of historical scans | scan_feature, status |
gim_check_runs_created | Counter | GitHub check runs created | plan, account_id |
gim_check_runs_timed_out | Counter | GitHub check runs that timed out | plan, account_id |
gim_check_runs_runtime_bucket | Histogram | GitHub check run duration | status |
gim_check_runs_error_codes | Counter | GitHub check run errors by code | error_code |
Infrastructure
| Metric | Type | Description | Dimensions |
|---|---|---|---|
gim_postgres_used_disk_bytes | Gauge | Disk space used by PostgreSQL | None |
gim_redis_used_memory_bytes | Gauge | Memory used by Redis | None |
gim_redis_available_memory_bytes | Gauge | Memory available for Redis | None |
Celery workers and queues
| Metric | Type | Description | Dimensions |
|---|---|---|---|
gim_celery_queue_length | Gauge | Tasks waiting in queue | queue_name |
gim_celery_active_consumer_count | Gauge | Active consumers in broker queue | queue_name |
gim_celery_worker_tasks_active | Gauge | Tasks currently being processed | None |
gim_celery_task_sent_total | Counter | Tasks sent to a queue | name, queue_name, team |
gim_celery_task_started_total | Counter | Tasks started by a worker | name, queue_name, team |
gim_celery_task_succeeded_total | Counter | Tasks completed successfully | name, queue_name, team |
gim_celery_task_failed_total | Counter | Tasks that failed | name, exception, queue_name, team |
gim_celery_task_retried_total | Counter | Tasks retried | name, queue_name, team |
gim_celery_task_queue_time_bucket | Histogram | Time spent waiting in queue | name, queue_name, team |
gim_celery_task_runtime_bucket | Histogram | Task execution duration | name, queue_name, team |
HTTP requests
| Metric | Type | Description | Dimensions |
|---|---|---|---|
gim_http_request_started_total | Counter | HTTP requests initiated | api, method, view_name |
gim_http_request_success_total | Counter | Successful HTTP requests | api, method, view_name |
gim_http_request_failure_total | Counter | Failed HTTP requests | api, method, status_code, view_name |
gim_http_request_exception_total | Counter | HTTP requests that raised an exception | api, method, view_name, exception |
gim_http_request_view_duration_seconds | Histogram | HTTP request duration per view | api, method, view_name |
Health checks
| Metric | Type | Description | Dimensions |
|---|---|---|---|
gim_health_check_result_count | Gauge | Health check results | service_name, status |
gim_outdated_health_check_count | Gauge | Health checks older than the periodic range | service_name |
gim_health_check_skipped_total | Counter | Health checks skipped | reason, service_name |
gim_health_check_duration_metric | Histogram | Health check execution duration | service_name |
Periodic tasks
| Metric | Type | Description | Dimensions |
|---|---|---|---|
gim_periodic_task_period_seconds | Gauge | Expected periodicity of a task | task_name, queue_name |
gim_periodic_task_not_run_for_seconds | Gauge | Time since a task was last run | task_name, queue_name |
Public API
| Metric | Type | Description | Dimensions |
|---|---|---|---|
gim_public_api_quota_total | Gauge | Maximum allowed API usage | Account |
gim_public_api_usage_total | Gauge | Current API usage | Account |
gim_public_api_token_total | Gauge | Active API tokens | Account, Type |
Recommended monitoring
System health
| Metric | What to watch for |
|---|---|
gim_celery_queue_length | Queue backlog growing over time is the first sign of system saturation. |
gim_celery_active_consumer_count | Drop in workers signals availability issues. |
gim_postgres_used_disk_bytes | Monitor disk pressure before it becomes critical. |
gim_redis_used_memory_bytes / gim_redis_available_memory_bytes | High ratio indicates cache memory pressure. |
gim_periodic_task_not_run_for_seconds | Compare against gim_periodic_task_period_seconds to detect stalled tasks. |
API and integrations
| Metric | What to watch for |
|---|---|
gim_http_request_failure_total | Filter by status_code to spot error rate spikes (especially 5xx). |
gim_http_request_view_duration_seconds | Track API latency (P95/P99) to detect slowdowns. |
gim_health_check_result_count | Filter by status=not_ok to detect broken integrations. |
Example PromQL queries
# Celery queue saturation (tasks per worker)
gim_celery_queue_length / gim_celery_active_consumer_count

# HTTP 5xx error rate over the last 5 minutes
rate(gim_http_request_failure_total{status_code=~"5.."}[5m])

# API latency P95 over the last 5 minutes
histogram_quantile(0.95, rate(gim_http_request_view_duration_seconds_bucket[5m]))

# Redis memory utilization (%)
gim_redis_used_memory_bytes / (gim_redis_used_memory_bytes + gim_redis_available_memory_bytes) * 100

# Detect stalled periodic tasks (not run for 2x their expected period)
gim_periodic_task_not_run_for_seconds > 2 * gim_periodic_task_period_seconds
Example alerting rules
Below are starter Prometheus alerting rules you can adapt to your environment:
groups:
  - name: gitguardian
    rules:
      - alert: CeleryQueueBacklog
        expr: gim_celery_queue_length > 100
        for: 5m
        annotations:
          summary: "Queue {{ $labels.queue_name }} has {{ $value }} pending tasks"

      - alert: RedisMemoryPressure
        expr: >
          gim_redis_used_memory_bytes
          / (gim_redis_used_memory_bytes + gim_redis_available_memory_bytes) > 0.85
        for: 10m

      - alert: PeriodicTaskStalled
        expr: gim_periodic_task_not_run_for_seconds > 2 * gim_periodic_task_period_seconds
        for: 5m

      - alert: HighHTTPErrorRate
        expr: rate(gim_http_request_failure_total{status_code=~"5.."}[5m]) > 0.1
        for: 5m
Visualizing metrics with Grafana
GitGuardian does not ship pre-built Grafana dashboards, but all gim_* metrics are standard Prometheus metrics and work with any Grafana instance connected to your Prometheus server.
To get started:
- Add your Prometheus server as a Grafana data source.
- Create panels using the PromQL queries above.
- Organize panels into rows: System health (queues, Redis, Postgres, periodic tasks) and API & Integrations (error rates, health checks).
Enable or disable Application metrics
Applicative metrics are deactivated by default. Two steps are needed to activate Application Metrics:
- authorize collection of metrics by the application
- activate Prometheus export
Authorize metrics collection
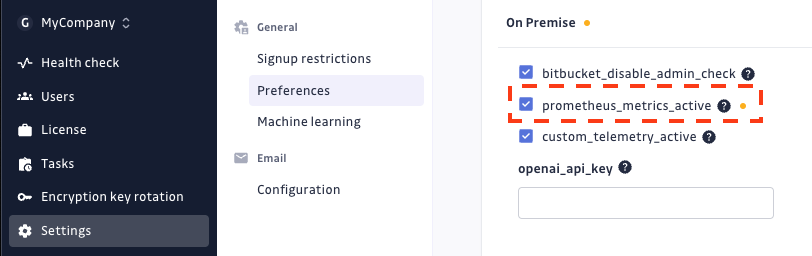
To authorize the metrics collection, you should go to the Preferences section
in the Admin Area, check the prometheus_metrics_active feature flag and
save settings.
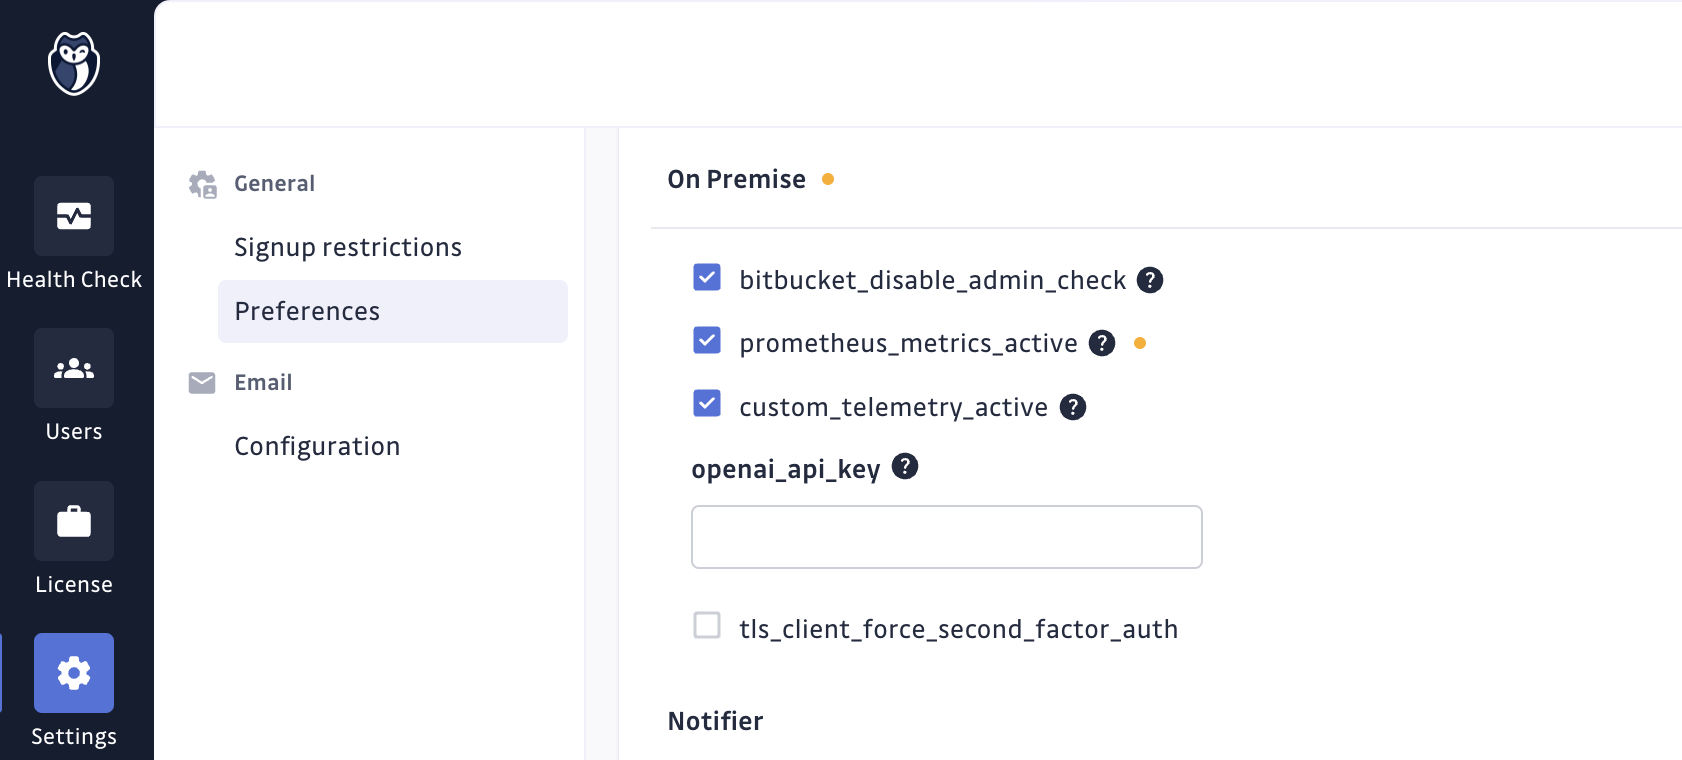
To disable it, you should uncheck this parameter and save settings.
Install Prometheus Operator
Metrics are collected by Prometheus using the Prometheus Operator.
For Existing Clusters, you should manually install it (installation documentation).
Activate Prometheus export using KOTS
To create exporter resources and allow automatic discovery, you should go in the KOTS Admin Console and check the Activate Prometheus Exporter checkbox in the Prometheus section of the configuration section.
Then save the configuration, and Deploy the application to apply the new configuration.
To disable it, you should uncheck this parameter, save configuration, and apply it through a new deployment.
Activate Prometheus export using Helm
Applicative metrics exporter can be enabled by setting observability.exporters.webAppExporter.enabled=true in values file.
observability:
  exporters:
    webAppExporter:
      enabled: true
Please note that Helm application also features a Celery Exporter allowing to monitor several Celery metrics like "count of active tasks by queue". The full list of metrics is available here.
You can activate Celery Exporter in your values file:
observability:
  exporters:
    webAppExporter:
      enabled: true
    statefulAppExporter:
      enabled: true
If you use Prometheus Operator, you may want to use the Service Monitor provided for automatic discovery of the exporter by Prometheus:
observability:
  exporters:
    webAppExporter:
      enabled: true
    statefulAppExporter:
      enabled: true
  serviceMonitors:
    enabled: true
Otherwise, you can manually scrape exporters.
- Applicative metrics can be scrapped from the app-exporter service at:
http://app-exporter:9808/metrics - Celery metrics can be scrapped from the celery-exporter service at:
http://celery-exporter:9808/metrics
How to collect metrics
On Existing Clusters, Prometheus must be installed and configured manually. If the Kube-Prometheus Operator is used, all the applicative metrics will be automatically listed thanks to the Discovery service of Kube-Prometheus Operator.
Otherwise, a manual configuration may be needed.
Applicative metrics discovery is possible through the app-monitoring headless service.
This service exposes an exporter pod serving metrics at http://exporter-xxxxx-xxxxx:9808/metrics
Usage data
GitGuardian collects usage data to improve the user experience and support. It can be easily deactivated by
adjusting the custom_telemetry_active setting found in the preferences
section in the Admin area.
Why keep usage data enable?
-
Continuous Product Improvement: usage data greatly helps us understand how our application is used in various environments. This allows us to specifically target areas needing improvements and direct our testing efforts. This ensures that our product evolves to meet our users' needs effectively while contributing to better quality and stability.
-
Targeted and Efficient Support: in case of technical problems, usage data enables GitGuardian to identify and resolve issues much more quickly. This means reduced downtime for you and a better overall user experience.
-
Security and Privacy: we want to reassure you that data privacy and security are our top priority. We do not collect any personal or sensitive data. Our goal is solely to improve user experience and the performance of our product.
Here are the categories and metrics we collect:
-
Replicated
- Various deployment-related metrics such as cloud status, version, and uptime
-
System
- SSO Provider
- Network Gateway Type
- Custom CA and proxy status
- Prometheus Application metrics activation status
-
Users & Teams
- Number of pending invitees, registered users with different access levels, active users.
-
Historical Scan
- Number of historical scans canceled, failed, and finished
- Percentile durations of historical scans
- Number of secrets found per day and source scans per day in historical scans
- Number of historical scans considered too large
-
Integrations
- Number of instances, installations, projects, sites for VCS and Other Data Sources
- Number of monitored and unmonitored sources, along with source size percentiles and estimated users per VCS
-
Secret
- Number of deactivated detectors per category, registered and unregistered feedbacks, and various metrics related to secret validity checks and incidents
-
Public API
- Number of calls for ggshield secrets scans, including different modes and repositories
- Number of active personal access tokens and service accounts
- Number of public API calls

