Generic Detectors landing on your non-VCS sources, powered by the False Positive Remover
![]() Release Date: July 8, 2026
Release Date: July 8, 2026
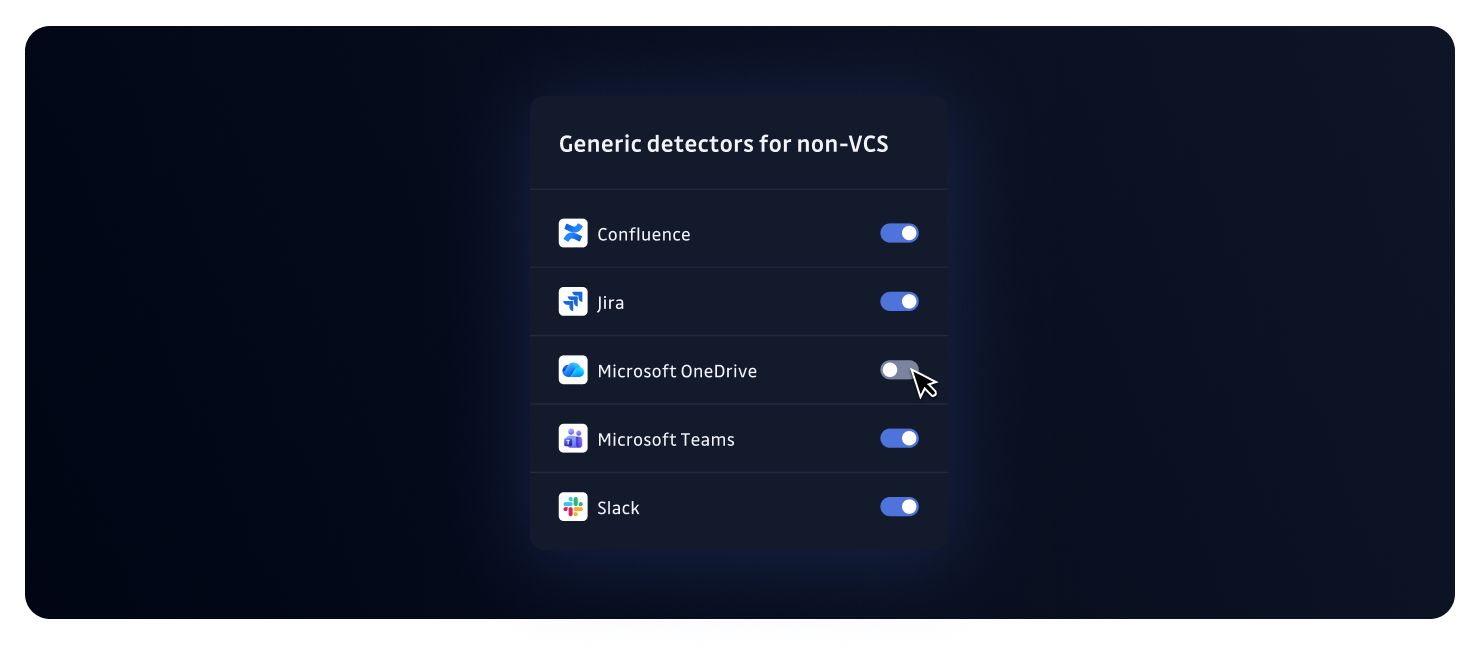
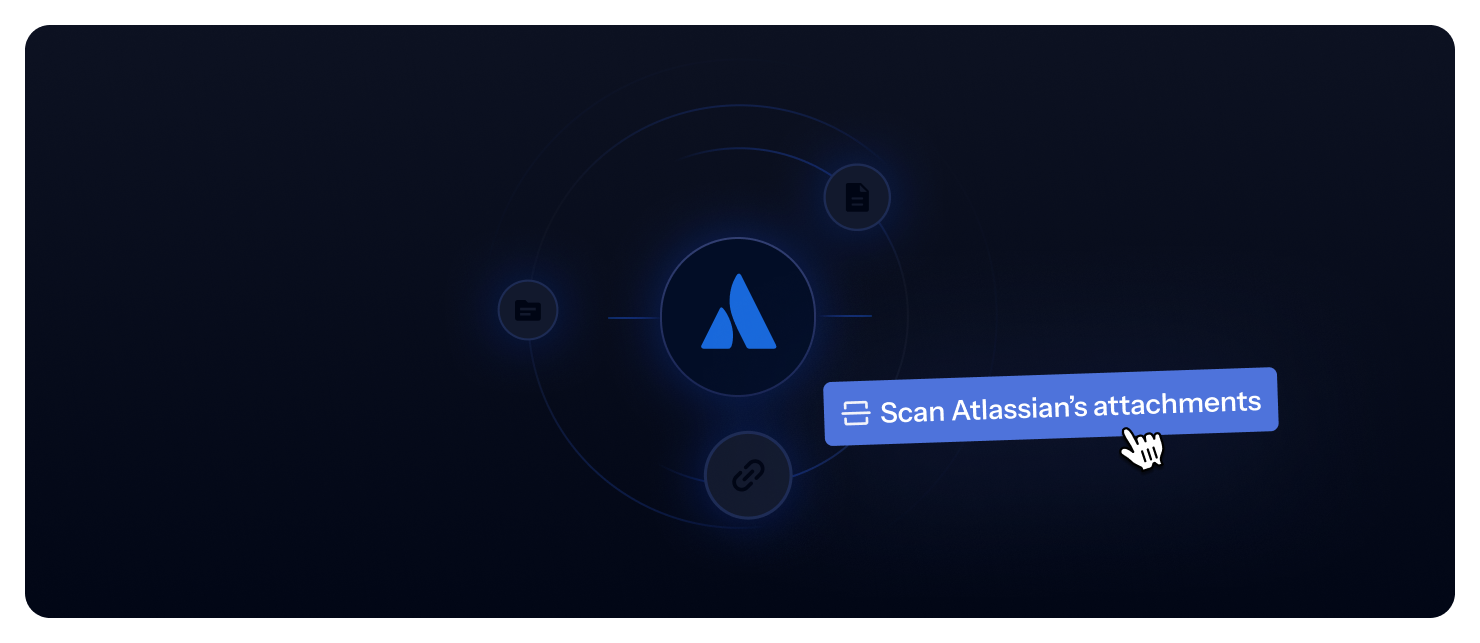
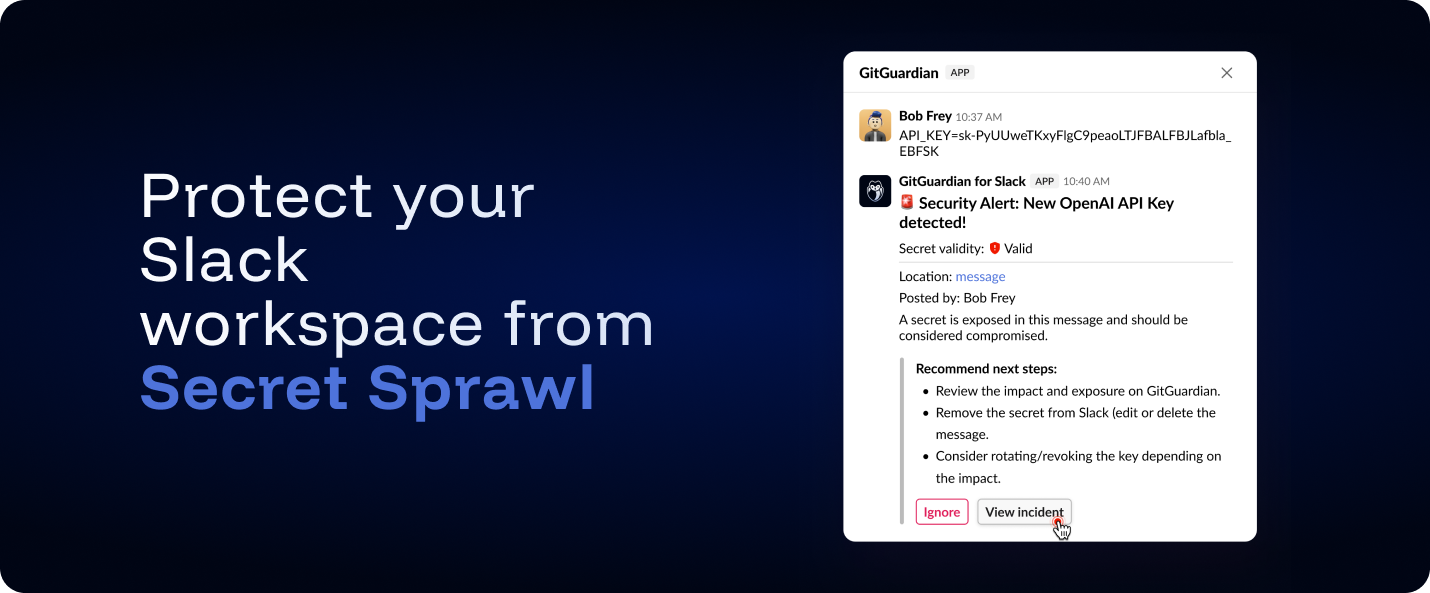
Until now, a generic password or high-entropy secret hardcoded in a Jira ticket, a Confluence page, or a Slack message went undetected. GitGuardian now runs Generic Password and Generic High Entropy Secret detection on your non-code sources (Confluence, Jira, Slack, Microsoft Teams, and others). This is one of the most requested improvements from teams who already monitor their code with GitGuardian and want the same coverage everywhere.
What does this mean for you?
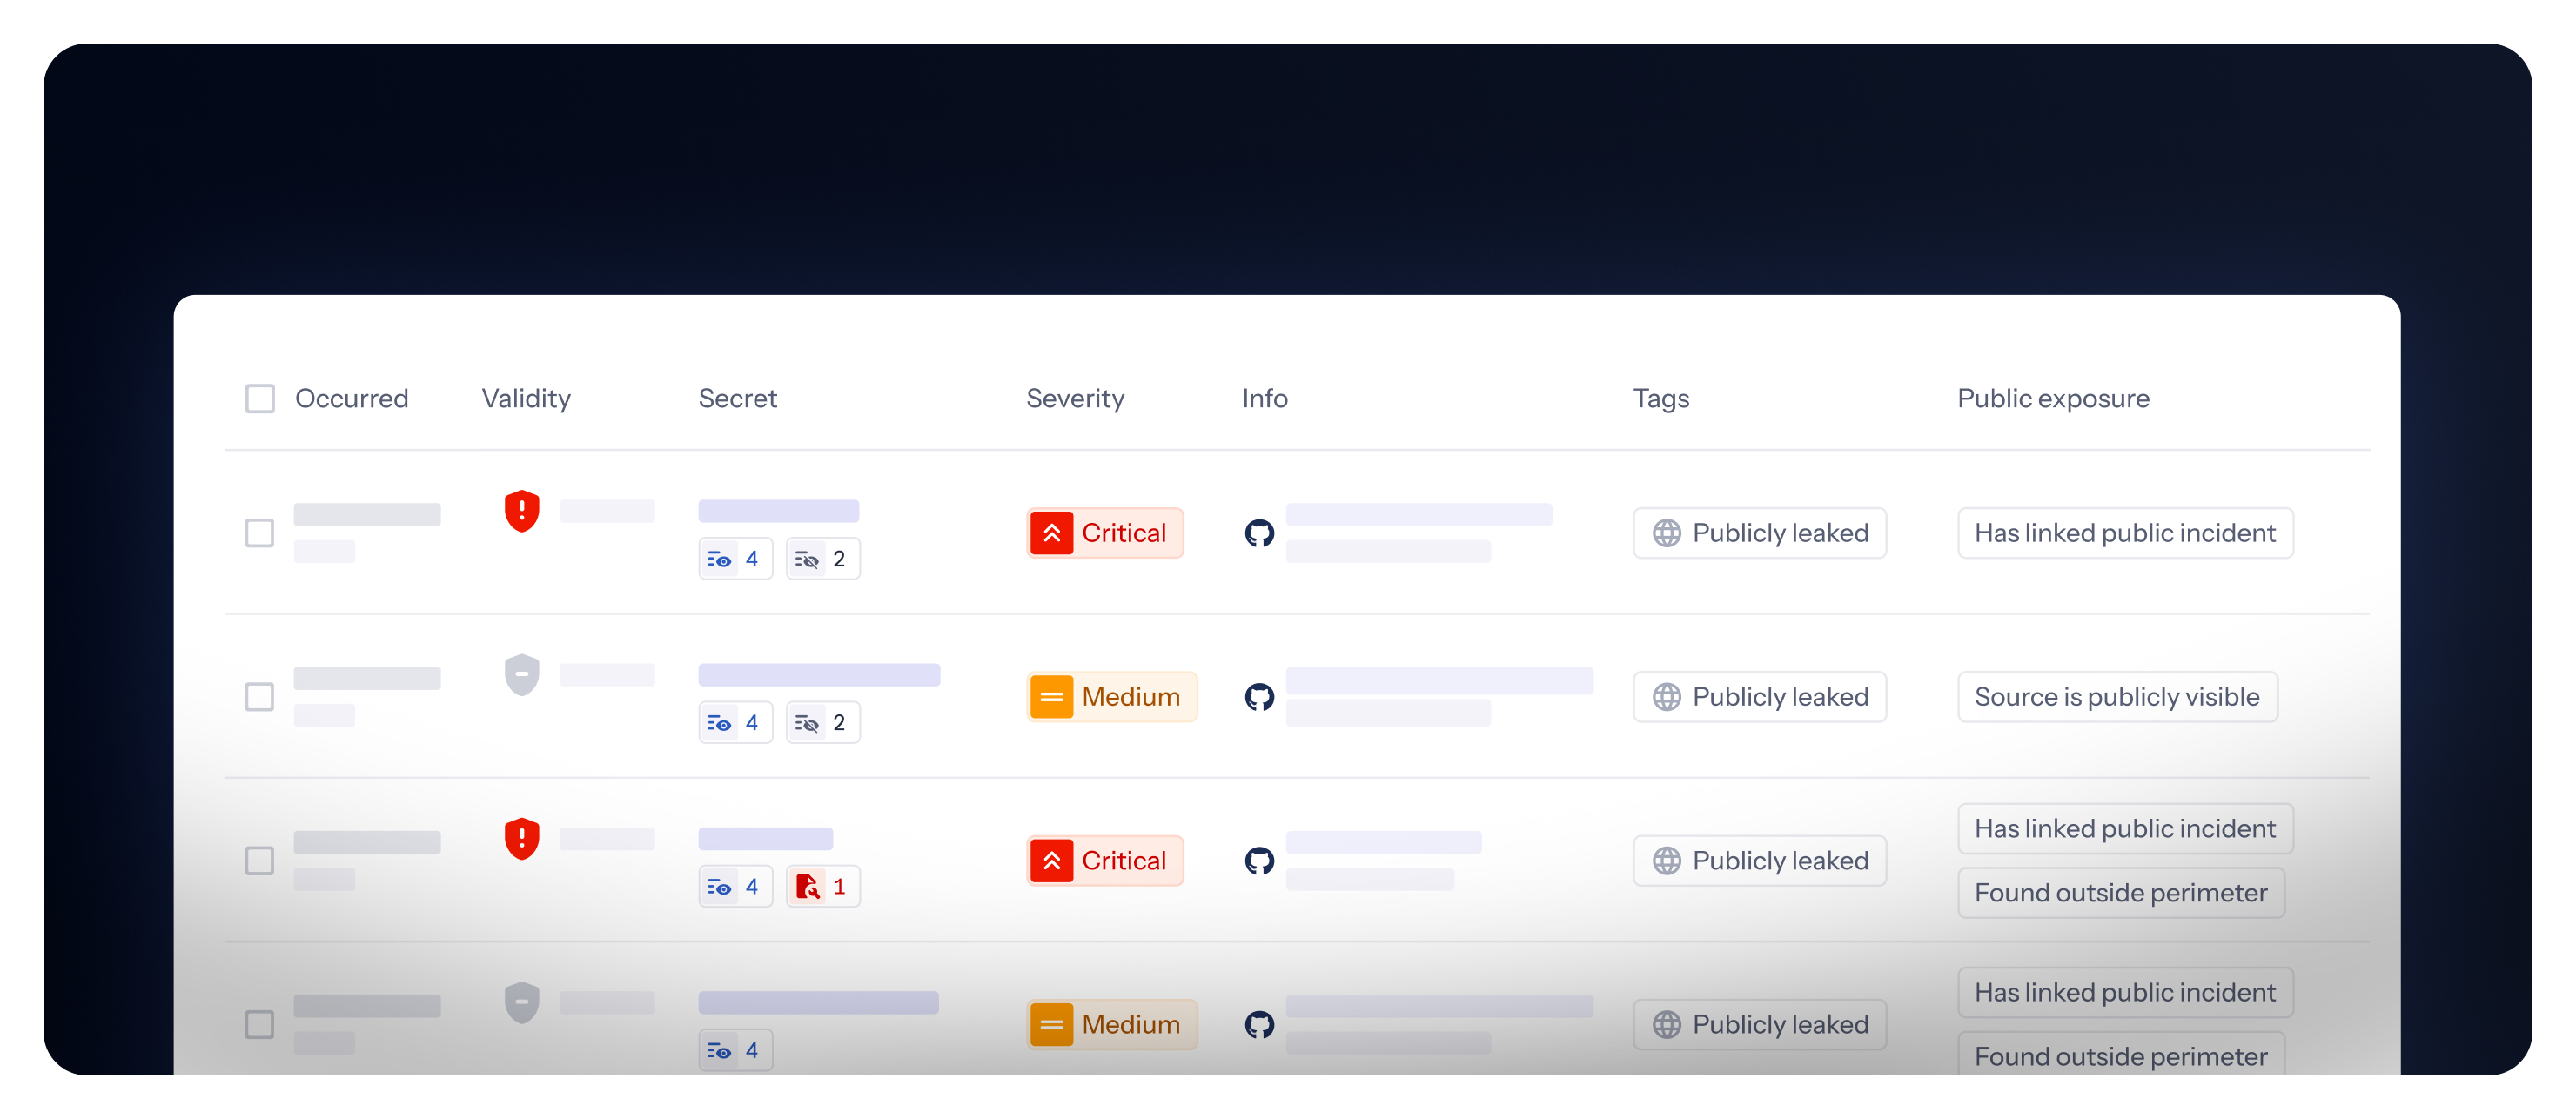
- Instant visibility: findings from your non-code sources that were previously hidden now appear in your dashboard, already flagged as false positives where it applies.
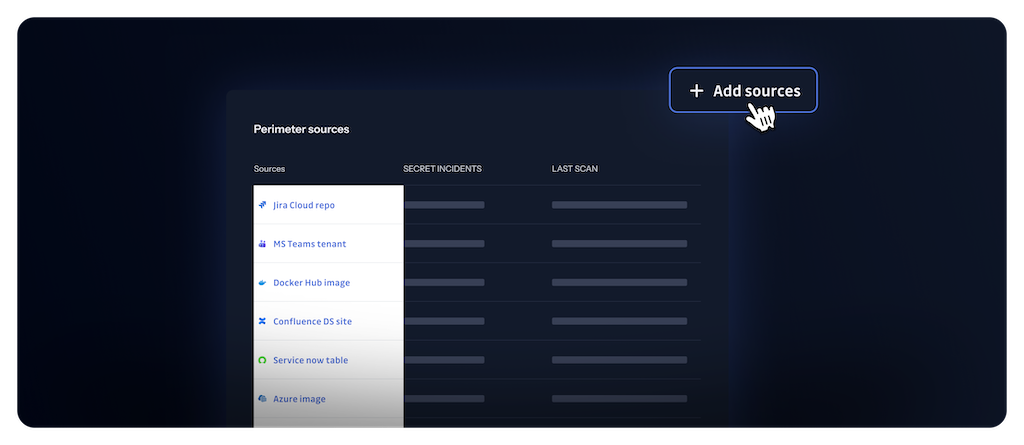
- Real-time coverage: any new content scanned from Confluence, Jira, Slack, Microsoft Teams, and other non-code sources immediately benefits from generic detection and false positive filtering.
Why is this important?
Generic detection now gives your non-code sources the same coverage you already rely on for your code. To keep that coverage high-signal, the False Positive Remover runs on every finding. It already filters your VCS findings, and we have extended it to non-code sources with an LLM-based model. In our benchmark, it identified 25 to 40% of generic findings as false positives and tagged them before they reached the dashboard.
The result: broader coverage, high signal.
Get Started Today!
Generic detection on non-code sources is enabled by default for Business accounts with AI features enabled. No action is required. To review or change your AI configuration, see AI settings.
Learn more about the False Positive Remover
Enhancements
- Jira Notifier: Added remediation guidance content and detector-specific links as assignable metadata fields in the Jira integration ticket description template.
Fixes
- Notifications: Fixed an issue where Discord webhook integrations failed to trigger on incident alerts.
- Incidents Dashboard: Fixed a display and filtering issue with the False Positive tag that caused it to behave incorrectly in the UI.
- Perimeter Management: Fixed an issue where toggling the Team Perimeter view between tree and list modes incorrectly marked the selection as modified.
- NHI Inventory: Fixed a data inconsistency where the "files requiring code fix" count could differ between the UI and API responses.